Why This Slide Is Useful
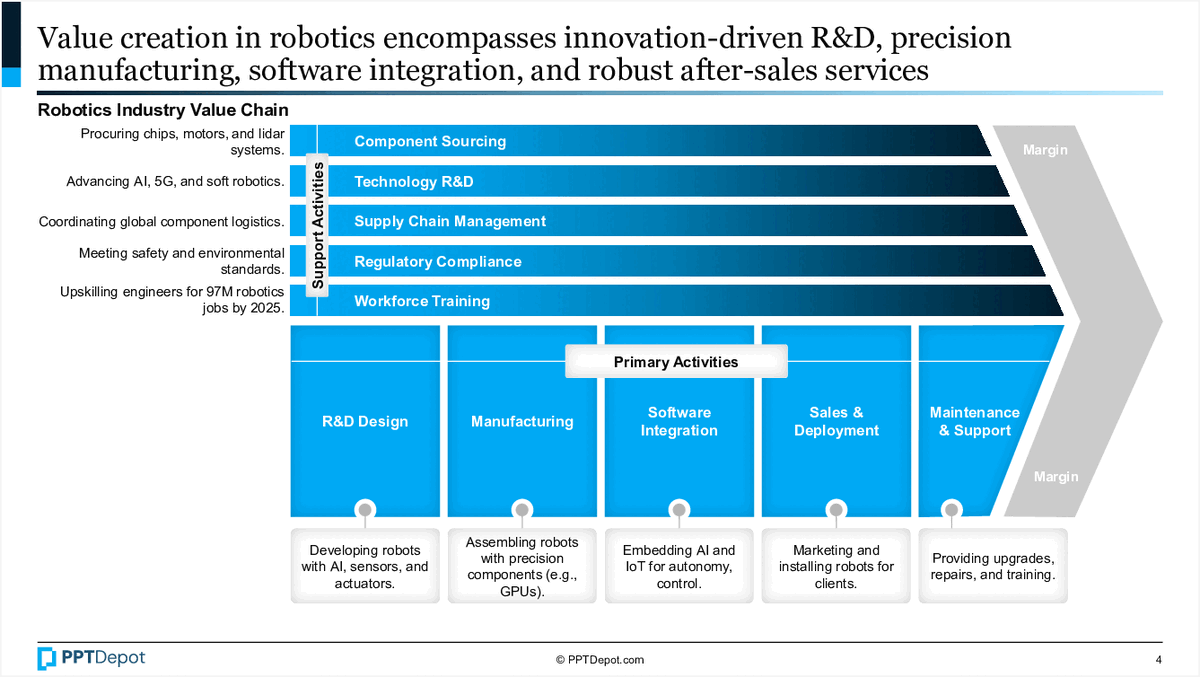
This slide is useful because it offers a clear visualization of how different functions contribute to value generation in robotics. For senior executives and strategists, understanding the industry’s value chain helps identify critical leverage points, potential bottlenecks, and areas for investment or partnership. It also clarifies the interconnectedness of R&D, manufacturing, and support activities, which are essential for competitive positioning.
The detailed breakdown of primary activities—ranging from R&D design to maintenance—serves as a diagnostic tool for assessing where a company’s strengths or gaps lie. For example, a firm might excel in supply chain management, but lag in workforce training, indicating targeted areas for improvement. This insight supports more informed resource allocation and strategic planning.
For consultants advising robotics clients, this slide provides a framework to evaluate industry benchmarks or develop differentiation strategies. It helps clients understand where value is created and how to optimize each segment for better margins or faster innovation cycles. Additionally, it offers a basis for competitive analysis by comparing a client’s capabilities against the industry standard.
In investor contexts, this value chain map aids in identifying high-growth segments or potential acquisition targets. Investors can assess which activities are ripe for disruption or consolidation, informing deal theses and post-investment value creation plans. The focus on innovation-driven activities like R&D and supply chain logistics aligns with areas where strategic investments can yield significant returns.
How This Slide Is Used
This slide is typically used during strategic planning sessions, industry analysis, or due diligence processes. Management teams leverage it to map their current operations against industry best practices or identify gaps in their value chain. It also serves as a reference point for discussions about vertical integration or outsourcing decisions.
Consultants often customize this framework to fit specific client contexts, such as highlighting proprietary capabilities or benchmarking against competitors. For example, a client may focus on strengthening their supply chain management or expanding workforce training programs based on insights from this map.
In corporate development or M&A scenarios, this slide helps evaluate potential targets by examining their core activities and support functions. It clarifies where synergies might exist or where integration risks could arise, guiding deal structuring and integration planning.
Furthermore, this value chain visualization supports communication with stakeholders, including investors or board members. It simplifies complex operational relationships into an accessible format, enabling clearer discussions around strategic priorities, investment areas, or innovation opportunities.
Related PPT Slides
AgriTech Value Chain Breakdown
This slide illustrates the comprehensive value chain of the AgriTech industry, highlighting core activities from R&D to support services. It emphasizes the integration of primary functions such as innovation, manufacturing, distribution, and implementation, alongside support activities like data analytics and partnerships, all aimed at driving industry margins and growth.
Autonomy Levels in Robotics and Logistics
This slide illustrates the progression of autonomy levels across different sectors, highlighting the increasing adoption of automation in logistics, healthcare, and industrial manufacturing. It details the percentage of tasks automated at each level, from consumer household tasks to fully autonomous warehouse robots, emphasizing the trajectory toward higher autonomy and efficiency gains.
Automotive Industry Value Chain
This slide maps the key activities within the automotive industry, highlighting primary and support functions that drive value creation and margin. It emphasizes how different segments, from R&D to aftersales, contribute to overall profitability and operational focus. The visual structure aids in understanding the interconnectedness of industry segments and their strategic importance.
This slide maps the key activities involved in solar value creation, from raw material sourcing to lifecycle servicing. It distinguishes primary activities—such as R&D, manufacturing, and installation—from support functions like logistics and workforce development, highlighting how each contributes to overall margins.
This slide provides an overview of how manufacturing is evolving in response to automation, sustainability, and supply chain disruptions. It highlights key industry statistics and emerging trends such as Industry 4.0 adoption, net-zero goals, supply chain resilience, workforce evolution, and additive manufacturing, offering a comprehensive snapshot for strategic decision-making.
Manufacturing Value Chain Overview
This slide illustrates the integrated manufacturing value chain, emphasizing how advanced technology and talent support core activities. It distinguishes primary activities like product design and assembly from support functions such as procurement and workforce training, highlighting the flow of value and margins across the chain. The visual layout underscores the interconnectedness of each stage in delivering manufacturing excellence.
Explore Slides by Tags
Download our FREE collection of over 50+ high-impact, fully editable PowerPoint templates. These professional templates cover a comprehensive range of strategic analysis frameworks—including Strategy Formulation, Innovation, Digital Transformation, Change Management, and many others—ideal for Management Consultants, Investment Bankers, Strategy Professionals, and Business Executives.
Trusted by Leading Global Organizations
Our templates are trusted by thousands of organizations worldwide, including leading brands such as those listed below.
Related Templates from PPT Depot

Leverage our domain and design expertise. Become a subscriber today:
Each presentation is available in 3 color schemes. Download the version that most fits your firm's branding and customize it further once you download the PPTX file.


PPT Depot is your subscription to high-impact management consulting and investment banking templates—crafted from real-world deliverables by ex-MBB consultants and designed by former McKinsey Visual Graphics (VGI) presentation specialists. Compare plans here to determine what's the best fit for your firm.
With 15 years of experience, the team behind PPT Depot has empowered over 500+ clients across over 30+ countries. We currently produce 200,000 slides annually.
PPT Depot releases new templates each week. We have management topic-focused templates (e.g. market analysis, strategic planning, digital transformation, and more), alongside industry-specific collections. Peruse our full inventory here.
Save time and effort—elevate your presentations with proven domain and design expertise.
Got a question? Email us at [email protected].
Related Consulting Presentations
These presentations below are available for individual purchase from Flevy , the marketplace for business best practices.

Slide Customization & Production
We provide tailored slide customization and production services:
- Conversion of scanned notes into PowerPoint slides
- Development of PowerPoint master template
- Creation of data-driven PowerPoint charts from hand-drawn graphs
- Conversion of Excel charts to PowerPoint charts
- Conversion of other file formats (e.g. PDF, TIF, Word Doc) to PowerPoint slides
- Conversion of PowerPoint slides from one master template to another
- Visual enhancement of existing PowerPoint presentations to increase the professional look of the presentation


