Consulting Proposal (22-slide PPT)
Thermometer Progress Visual (5-slide PPT)
Donut Ring with Central KPI Value (6-slide PPT)
IT Infrastructure Transformation (16-slide PPT)
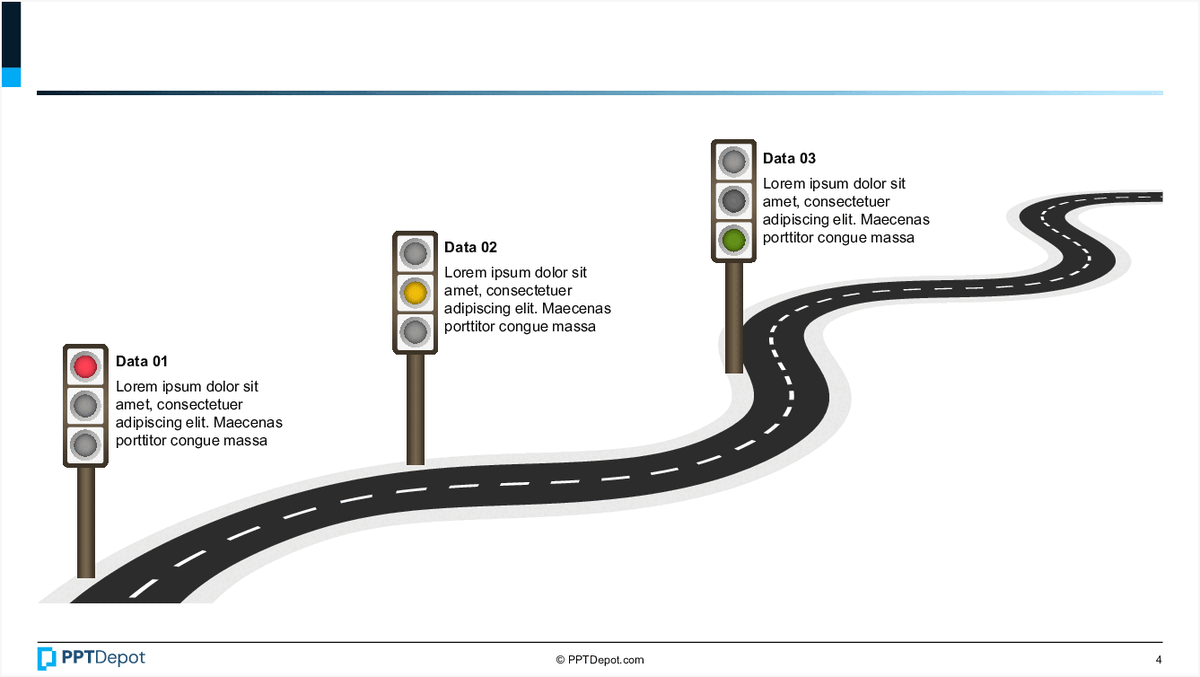
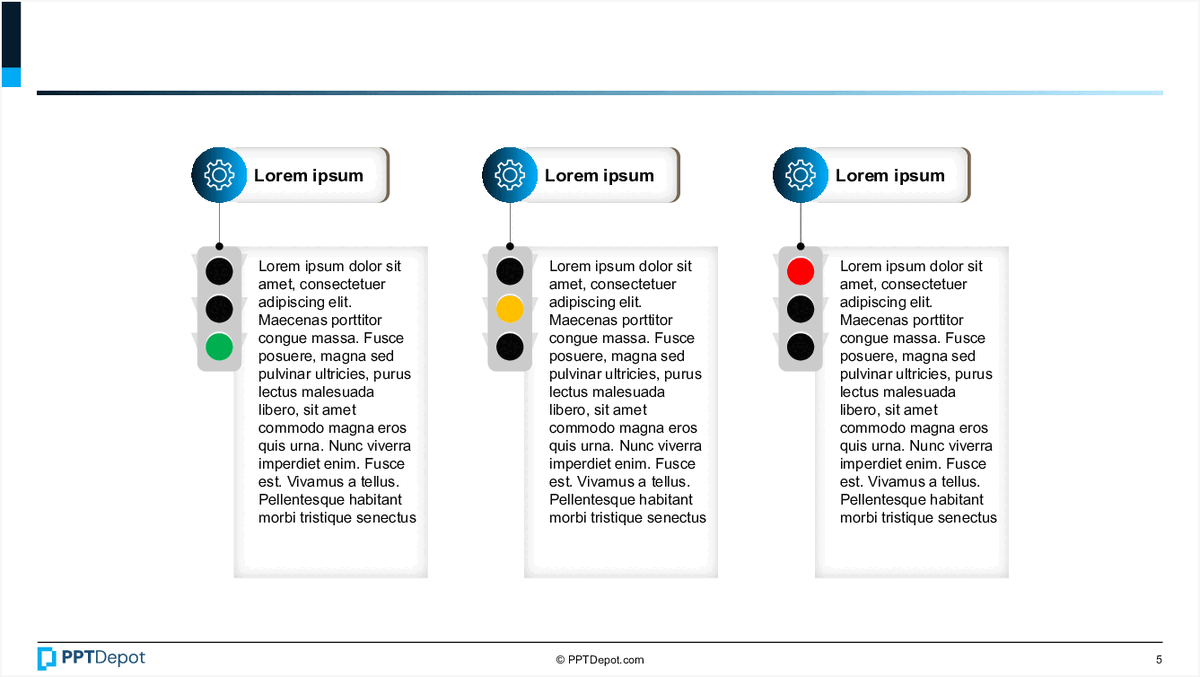
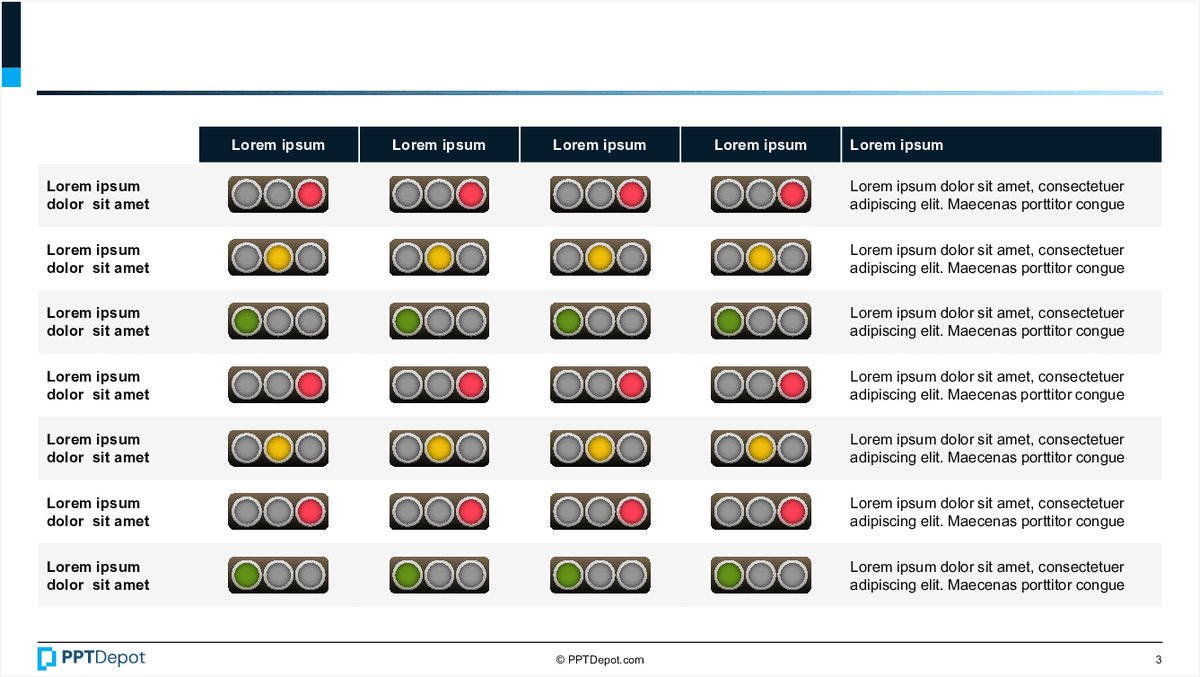
Traffic Light RAG Indicators (5-slide PPT)
IT Project Risk & Performance Review (14-slide PPT)
Executive One-Pager Dashboard (5-slide PPT)
Phase X Overview and Tracker
Executive Summary Performance Highlights
Executive Summary Highlights
Phase X Strategic Focus
Infrastructure Maturity and Action Plan
Roadmap with Data Milestones
CSS Action Progress Tracking
Project Status Overview
Quarterly Service Improvement Summary
Traffic Light Status Overview
Data Visualization of Progress Metrics
Data Visualization of Percentages
Thermometer Comparison Chart
Project Status Dashboard Overview
Progress Bar with Descriptions
Progression of Milestones