
Why This Slide Is Useful
This slide is valuable for senior executives and strategy consultants analyzing industry positioning or considering organizational restructuring. It offers a clear visual of how various companies are aligned in terms of operational scope, which informs decisions on market entry, expansion, or consolidation strategies.
For C-level leaders, understanding where competitors or potential partners sit on this map helps shape strategic initiatives that leverage or counteract existing market positions. It also supports discussions around the optimal balance between centralization and decentralization to maximize efficiency, agility, or control.
Management consultants can use this map to diagnose client organizational models and recommend targeted restructuring efforts. It provides a straightforward way to compare client positioning against industry norms or best practices, facilitating strategic planning sessions or transformation roadmaps.
This visual also aids in stakeholder communication, especially when explaining complex strategic choices in a simplified format. It can be integrated into presentations to board members or investors, illustrating the rationale behind strategic shifts or investments in operational models.
How This Slide Is Used
This slide is typically used during strategic planning, competitive analysis, or organizational design workshops. It helps leadership teams visualize where their company and competitors stand in terms of operational scope and scale, guiding decisions on future positioning.
In consulting engagements, this map is often customized to include specific clients or industry players, highlighting gaps or opportunities. For example, a client considering decentralization might compare their position to industry leaders to assess the feasibility and impact of such a move.
Executives also leverage this slide in M&A scenarios, evaluating potential targets based on their strategic fit within the map. It supports discussions on whether to acquire a centralized or decentralized entity, or to shift the existing model to better align with market trends.
Additionally, this map can be used in internal strategy sessions to challenge assumptions about operational scope. It prompts teams to consider whether their current model is optimal or if repositioning could unlock new value or improve competitive standing.
Related PPT Slides

Competitive Field Map Overview PPT Slide
This slide illustrates a strategic positioning framework that maps companies along a spectrum from centralized to decentralized operations and from local to global scale. It visually categorizes firms based on their operational scope and organizational structure, providing a quick reference for competitive analysis and market positioning. The layout supports strategic discussions around market entry, expansion, and organizational design.

Competitive Field Map Overview PPT Slide
This slide illustrates a strategic positioning framework that maps companies along axes of centralization versus decentralization and local versus global scale. It visually categorizes multiple firms within a two-dimensional space, highlighting their relative market positions and operational models. The diagram aids in understanding competitive dynamics and strategic choices across different organizational configurations.

Strategy Canvas for Market Opportunities PPT Slide
This slide illustrates a strategy canvas that maps the current competitive landscape across key features, highlighting areas where value innovation can occur. It compares 3 companies’ performance levels on 7 features, providing a visual overview of market positioning and potential differentiation points for strategic focus.
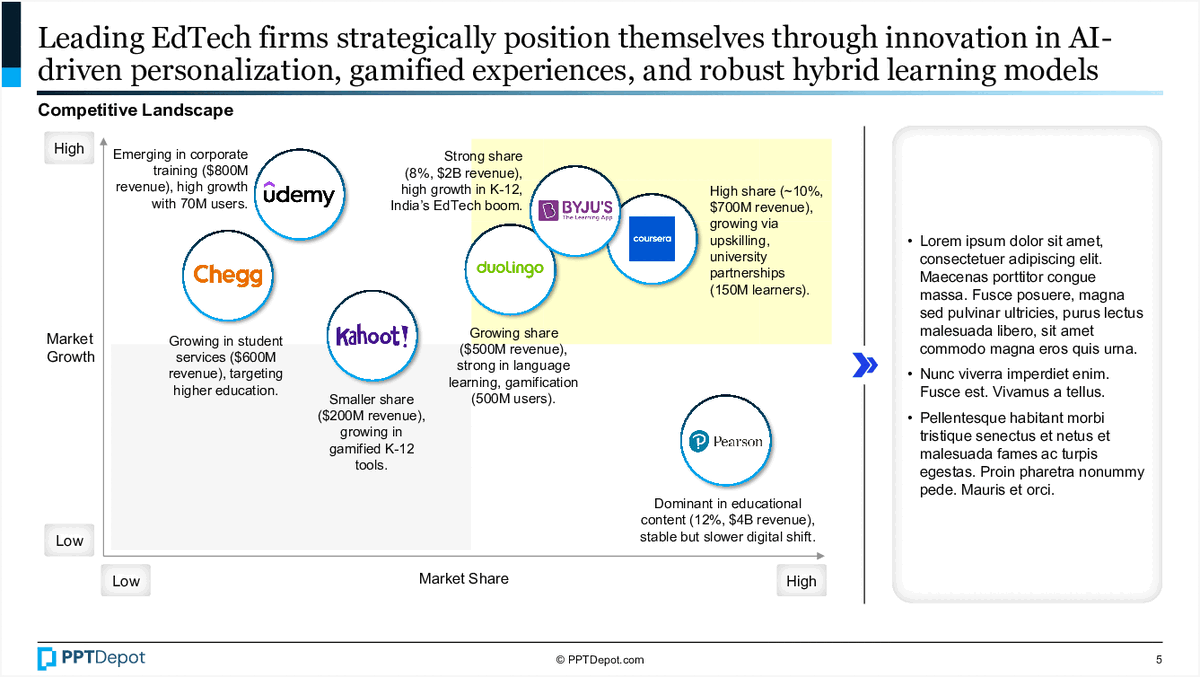
EdTech Firms Market Positioning PPT Slide
This slide illustrates the competitive landscape of leading EdTech companies, mapping their market share against growth potential. It visually categorizes firms based on their revenue, growth trajectory, and market share, providing a strategic snapshot of industry positioning for investors, strategists, and corporate development teams.

Market Analysis Key Questions PPT Slide
This slide outlines ten critical questions to consider when conducting a comprehensive market analysis. It visually organizes these questions around a central theme, emphasizing key areas such as market size, growth, competition, and value chain. The accompanying text provides context for each question, supporting strategic decision-making processes.

Strategy Canvas for Market Opportunities PPT Slide
This slide illustrates a strategy canvas that visualizes the current competitive landscape across multiple features for 3 companies. It highlights areas of strength and weakness, helping executives identify where value innovation can be pursued by shifting focus or redefining industry boundaries.
Explore Slides by Tags


Download our FREE collection of over 50+ high-impact, fully editable PowerPoint templates. These professional templates cover a comprehensive range of strategic analysis frameworks—including Strategy Formulation, Innovation, Digital Transformation, Change Management, and many others—ideal for Management Consultants, Investment Bankers, Strategy Professionals, and Business Executives.
Trusted by Leading Global Organizations
Our templates are trusted by thousands of organizations worldwide, including leading brands such as those listed below.
Related Templates from PPT Depot


Leverage our domain and design expertise. Become a subscriber today:
Each presentation is available in 3 color schemes. Download the version that most fits your firm's branding and customize it further once you download the PPTX file.


![]()
PPT Depot is your subscription to high-impact management consulting and investment banking templates—crafted from real-world deliverables by ex-MBB consultants and designed by former McKinsey Visual Graphics (VGI) presentation specialists. Compare plans here to determine what's the best fit for your firm.
With 15 years of experience, the team behind PPT Depot has empowered over 500+ clients across over 30+ countries. We currently produce 200,000 slides annually.
PPT Depot releases new templates each week. We have management topic-focused templates (e.g. market analysis, strategic planning, digital transformation, and more), alongside industry-specific collections. Peruse our full inventory here.
Save time and effort—elevate your presentations with proven domain and design expertise.
Got a question? Email us at [email protected].
Related Consulting Presentations
These presentations below are available for individual purchase from Flevy , the marketplace for business best practices.

Slide Customization & Production
We provide tailored slide customization and production services:
- Conversion of scanned notes into PowerPoint slides
- Development of PowerPoint master template
- Creation of data-driven PowerPoint charts from hand-drawn graphs
- Conversion of Excel charts to PowerPoint charts
- Conversion of other file formats (e.g. PDF, TIF, Word Doc) to PowerPoint slides
- Conversion of PowerPoint slides from one master template to another
- Visual enhancement of existing PowerPoint presentations to increase the professional look of the presentation