
Why This Slide Is Useful
This slide is valuable for senior executives and strategy consultants analyzing organizational structures within an industry or portfolio. It offers a clear visual of how companies balance central control versus local autonomy, which influences decision-making, agility, and resource allocation. Understanding these positioning points helps identify best practices, gaps, or opportunities for restructuring or benchmarking.
For C-level leaders, the map supports strategic discussions about future operating models aligned with growth ambitions or market demands. It clarifies where a company currently stands and guides decisions on whether to centralize functions for efficiency or decentralize for responsiveness. This insight informs transformation initiatives, M&A integration, or competitive positioning.
Management consultants leverage this slide to diagnose client organizational design and recommend optimal structures. The visual facilitates stakeholder conversations around the trade-offs of different models, helping clients understand the implications of shifting from decentralized to centralized operations or vice versa. It also aids in scenario planning for future organizational evolution.
Investors and PE firms use this map to assess the strategic posture of portfolio companies. It highlights how operational models align with market scope and growth strategies, influencing valuation and value creation plans. The slide supports due diligence, strategic planning, and post-investment restructuring efforts by providing a comparative framework.
How This Slide Is Used
This slide is typically used in strategic planning sessions, organizational diagnostics, or industry benchmarking exercises. It serves as a conversation starter around the strategic rationale behind different organizational models and their impact on performance.
In consulting engagements, the map is often customized to include additional dimensions such as digital maturity or customer focus. It helps clients visualize where they stand relative to competitors and identify potential shifts needed to improve agility or efficiency. For example, a client may be highly decentralized, but facing challenges with scale, prompting a discussion on centralization.
PE firms and investors use this slide during due diligence to evaluate how operational structure supports growth plans or risk management. It can reveal whether a company’s model is aligned with its market scope or if structural adjustments are necessary to unlock value.
Organizations also utilize this map in internal strategic reviews or transformation programs. It guides decision-making on restructuring initiatives, resource reallocation, or technology investments. The visual nature of the slide makes it easier to communicate complex organizational concepts to diverse stakeholders, including board members and operational leaders.
Related PPT Slides

Business Model Components Breakdown PPT Slide
This slide illustrates the key elements required to develop a successful business model, emphasizing the integration of customer value proposition, profit formula, and key resources and processes. It visually demonstrates how these components combine to form a comprehensive business model framework, supported by placeholder text for detailed descriptions.
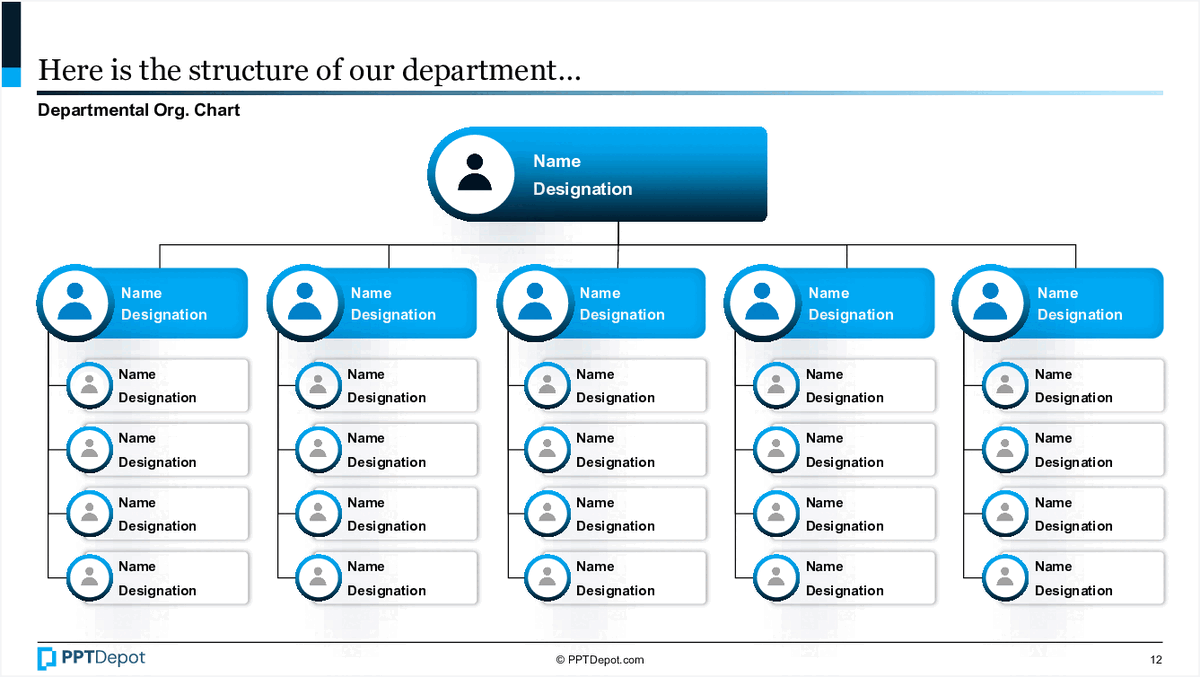
Departmental Organizational Chart PPT Slide
This slide illustrates the hierarchical structure of a department, highlighting key roles and reporting lines. It uses a visual format with icons and placeholders for names and designations, enabling quick understanding of team composition and leadership distribution at a glance.

Competitive Field Map Overview PPT Slide
This slide illustrates a strategic positioning framework that maps companies along a spectrum from centralized to decentralized operations and from local to global scale. It visually categorizes firms based on their operational scope and organizational structure, providing a quick reference for competitive analysis and market positioning. The layout supports strategic discussions around market entry, expansion, and organizational design.

Strategic Positioning Map PPT Slide
This slide illustrates a competitive field map that visualizes different strategic positioning models, ranging from centralized to decentralized operational structures. It plots multiple companies along axes representing local versus global scale, helping to identify their relative positioning and strategic choices in the market landscape.
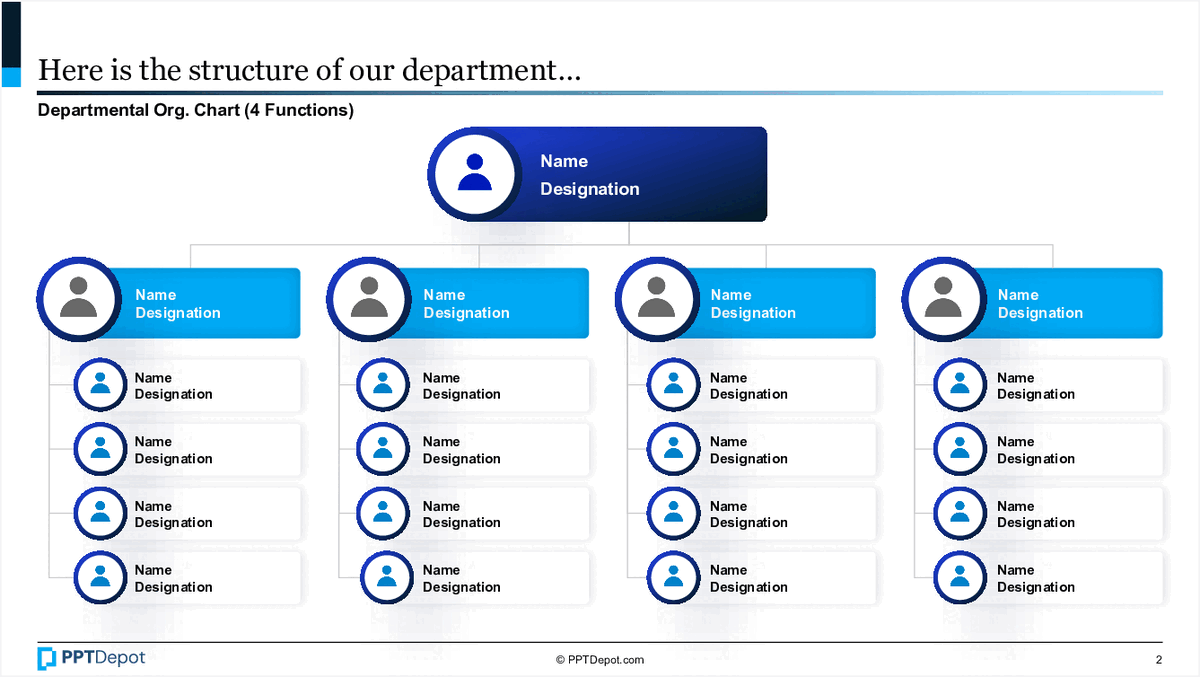
Departmental Organizational Structure PPT Slide
This slide illustrates the hierarchical layout of a department, highlighting 4 main functions and their respective team members. It provides a clear visual of reporting lines and team composition, designed for quick comprehension by senior management and strategic planners.
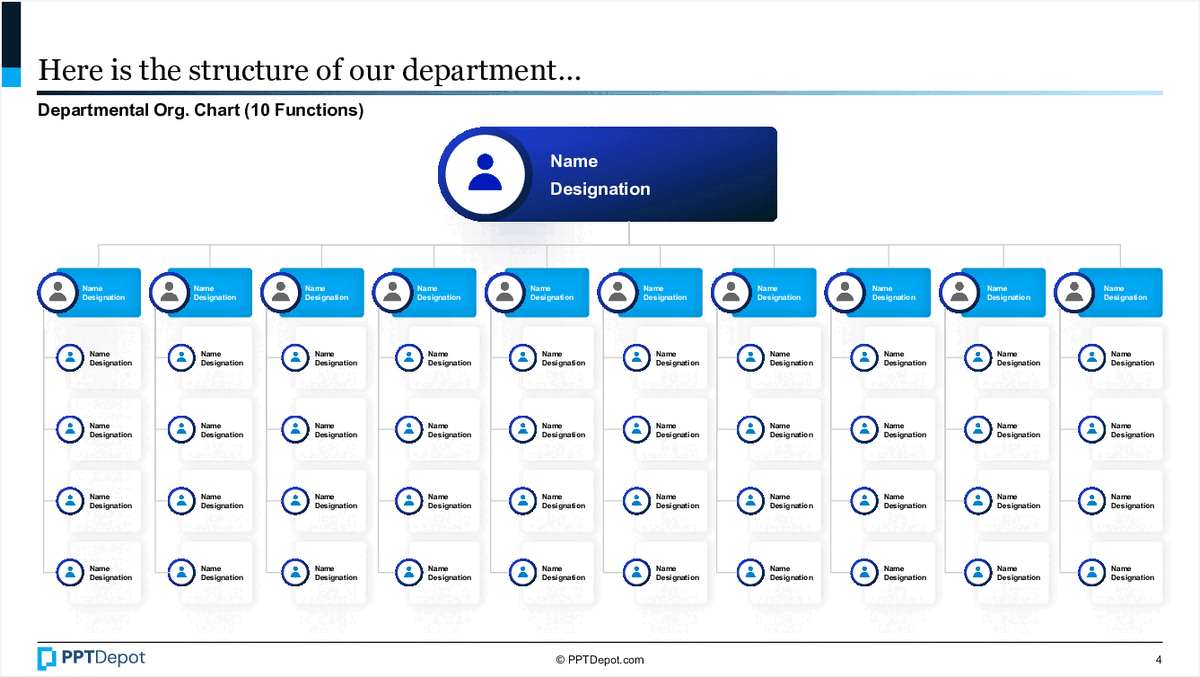
Departmental Organizational Chart PPT Slide
This slide displays a hierarchical structure of a department, illustrating the reporting relationships among ten functions. It uses icons and color coding to differentiate roles and positions, providing a clear visual of the department’s composition and reporting lines for strategic or operational review.
Explore Slides by Tags


Download our FREE collection of over 50+ high-impact, fully editable PowerPoint templates. These professional templates cover a comprehensive range of strategic analysis frameworks—including Strategy Formulation, Innovation, Digital Transformation, Change Management, and many others—ideal for Management Consultants, Investment Bankers, Strategy Professionals, and Business Executives.
Trusted by Leading Global Organizations
Our templates are trusted by thousands of organizations worldwide, including leading brands such as those listed below.
Related Templates from PPT Depot


Leverage our domain and design expertise. Become a subscriber today:
Each presentation is available in 3 color schemes. Download the version that most fits your firm's branding and customize it further once you download the PPTX file.


![]()
PPT Depot is your subscription to high-impact management consulting and investment banking templates—crafted from real-world deliverables by ex-MBB consultants and designed by former McKinsey Visual Graphics (VGI) presentation specialists. Compare plans here to determine what's the best fit for your firm.
With 15 years of experience, the team behind PPT Depot has empowered over 500+ clients across over 30+ countries. We currently produce 200,000 slides annually.
PPT Depot releases new templates each week. We have management topic-focused templates (e.g. market analysis, strategic planning, digital transformation, and more), alongside industry-specific collections. Peruse our full inventory here.
Save time and effort—elevate your presentations with proven domain and design expertise.
Got a question? Email us at [email protected].
Related Consulting Presentations
These presentations below are available for individual purchase from Flevy , the marketplace for business best practices.

Slide Customization & Production
We provide tailored slide customization and production services:
- Conversion of scanned notes into PowerPoint slides
- Development of PowerPoint master template
- Creation of data-driven PowerPoint charts from hand-drawn graphs
- Conversion of Excel charts to PowerPoint charts
- Conversion of other file formats (e.g. PDF, TIF, Word Doc) to PowerPoint slides
- Conversion of PowerPoint slides from one master template to another
- Visual enhancement of existing PowerPoint presentations to increase the professional look of the presentation