
Why This Slide Is Useful
This slide is valuable for senior management and strategic planners aiming to streamline project selection. It offers a clear, visual method to evaluate initiatives beyond raw impact, incorporating feasibility and strategic alignment. This approach helps leaders focus on initiatives that deliver the most value while considering resource constraints.
For C-level executives and strategy teams, this framework simplifies complex prioritization decisions. It encourages a disciplined approach to selecting projects that align with long-term goals, reducing the risk of pursuing initiatives that may be impactful, but impractical or misaligned with strategic objectives.
The slide also supports communication with stakeholders by providing a transparent, structured process. Leaders can use it to justify prioritization choices during portfolio reviews or strategic planning sessions, ensuring alignment across functions and clarity in resource deployment.
Additionally, the visual nature of the slide makes it easy to adapt for different contexts, such as annual planning, innovation pipelines, or transformation initiatives. It helps maintain focus on the most promising projects, avoiding dilution of efforts across too many competing priorities.
How This Slide Is Used
This slide is typically used during strategic planning, project portfolio management, or decision-making workshops. It serves as a reference point for evaluating and ranking initiatives based on predefined filters, ensuring a balanced approach to resource allocation.
In practice, leadership teams often use this framework to facilitate discussions on which projects to advance or delay. They may assign scores or qualitative assessments to each filter for individual initiatives, then visualize the overall prioritization. This process helps surface trade-offs and align on strategic focus areas.
Consultants and internal strategists leverage this slide to structure client conversations around project selection. It provides a common language and visual tool to challenge assumptions and refine strategic choices, especially when dealing with large portfolios or complex decision criteria.
In execution, the slide supports ongoing portfolio reviews. As initiatives progress, teams can revisit the filters to reassess priorities based on new information or changing strategic landscapes. This iterative use ensures that resource deployment remains aligned with evolving organizational goals.
Related PPT Slides
Strategic Initiative Prioritization Filters PPT Slide
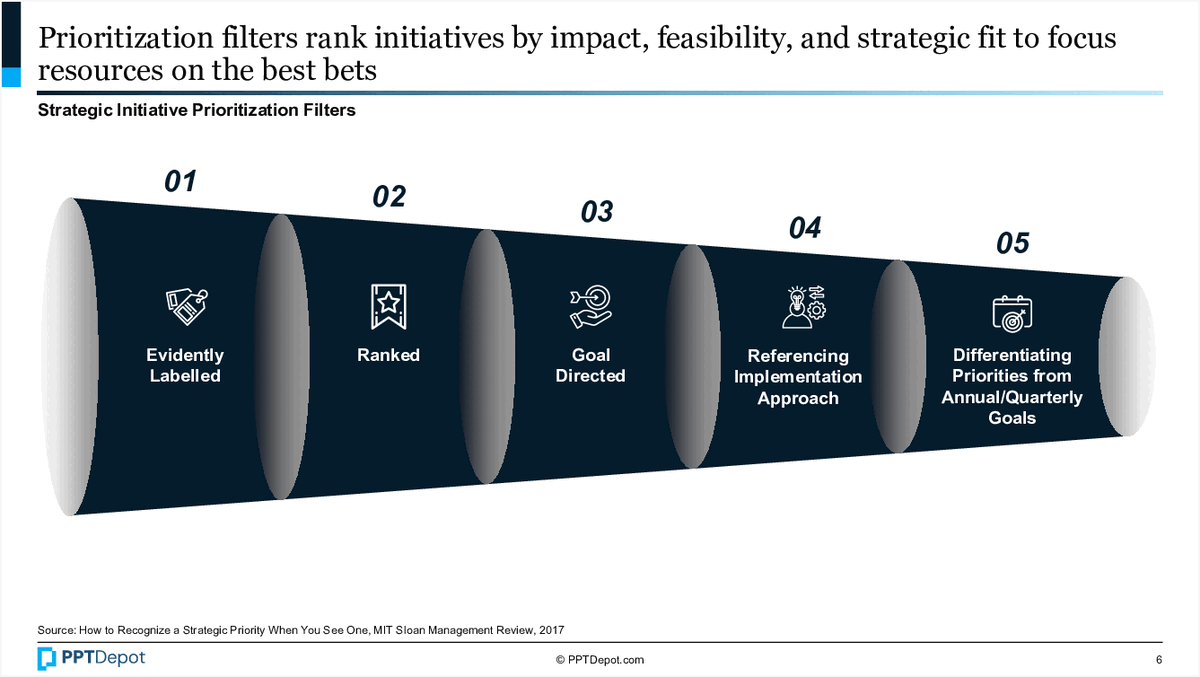
This slide illustrates a framework for ranking strategic initiatives based on impact, feasibility, and alignment with strategic goals. It presents 5 key filters—ranging from being evidently labeled to differentiating priorities from annual or quarterly goals—that help decision-makers focus resources on the most promising projects. The visual emphasizes a funnel-like approach to narrowing down initiatives for execution.

Business Model Components Breakdown PPT Slide
This slide illustrates the key elements required to develop a successful business model, emphasizing the integration of customer value proposition, profit formula, and key resources and processes. It visually demonstrates how these components combine to form a comprehensive business model framework, supported by placeholder text for detailed descriptions.
Portfolio Attribute Comparison Analysis PPT Slide
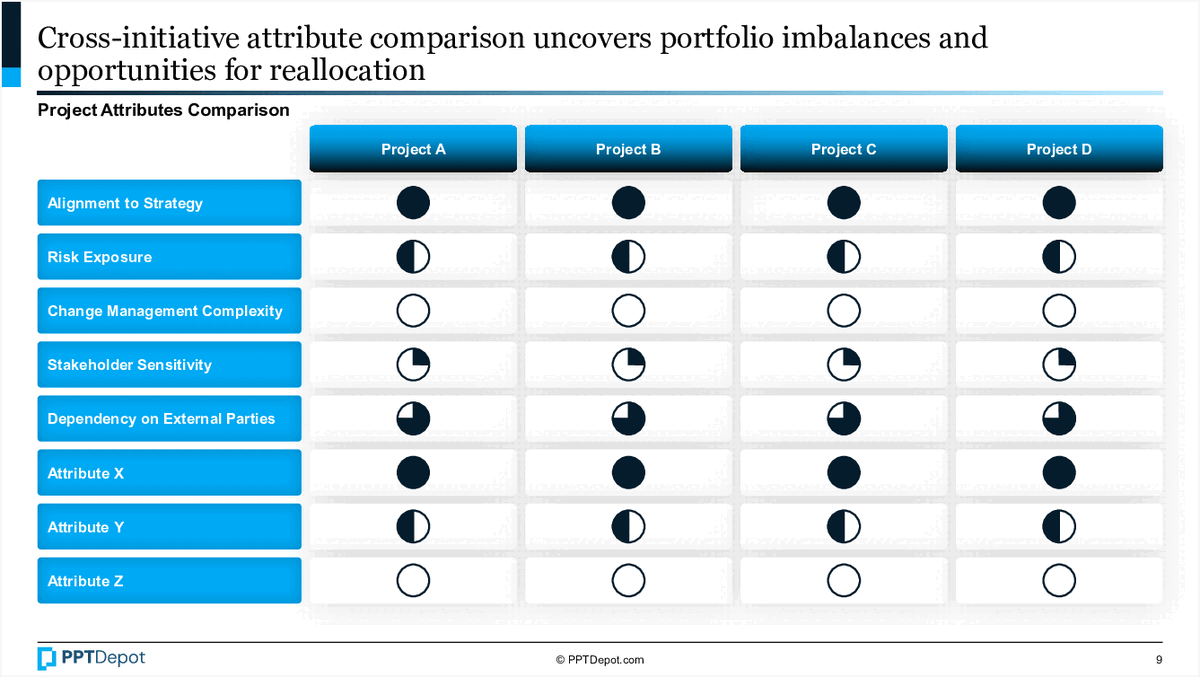
This slide compares multiple projects across several key attributes, highlighting imbalances and potential areas for reallocation. It uses visual indicators like filled and unfilled circles to quickly communicate the relative strengths and weaknesses of each project in relation to strategic priorities and risk factors.

Balanced Scorecard Linking Measures PPT Slide
This slide illustrates how the Balanced Scorecard connects key performance indicators across 4 perspectives to demonstrate their impact on financial and operational outcomes. It visualizes the cause-and-effect relationships between customer satisfaction, employee morale, internal processes, and financial results, emphasizing the integrated nature of strategic measurement.

Build vs. Buy Cost-Benefit Analysis PPT Slide
This slide compares the benefits and risks associated with building versus buying options, using a visual scale analogy. It highlights the different factors to consider in weighing costs, benefits, and risks, providing a clear framework for decision-making at the strategic level.

Four Actions Framework for Value Creation PPT Slide
This slide illustrates the Four Actions Framework, a strategic tool to help organizations reshape buyer value by identifying factors to eliminate, reduce, raise, or create. It emphasizes a structured approach to crafting a new value curve, supported by visual icons and guiding questions that facilitate strategic differentiation and innovation.
Explore Slides by Tags


Download our FREE collection of over 50+ high-impact, fully editable PowerPoint templates. These professional templates cover a comprehensive range of strategic analysis frameworks—including Strategy Formulation, Innovation, Digital Transformation, Change Management, and many others—ideal for Management Consultants, Investment Bankers, Strategy Professionals, and Business Executives.
Trusted by Leading Global Organizations
Our templates are trusted by thousands of organizations worldwide, including leading brands such as those listed below.
Related Templates from PPT Depot


Leverage our domain and design expertise. Become a subscriber today:
Each presentation is available in 3 color schemes. Download the version that most fits your firm's branding and customize it further once you download the PPTX file.


![]()
PPT Depot is your subscription to high-impact management consulting and investment banking templates—crafted from real-world deliverables by ex-MBB consultants and designed by former McKinsey Visual Graphics (VGI) presentation specialists. Compare plans here to determine what's the best fit for your firm.
With 15 years of experience, the team behind PPT Depot has empowered over 500+ clients across over 30+ countries. We currently produce 200,000 slides annually.
PPT Depot releases new templates each week. We have management topic-focused templates (e.g. market analysis, strategic planning, digital transformation, and more), alongside industry-specific collections. Peruse our full inventory here.
Save time and effort—elevate your presentations with proven domain and design expertise.
Got a question? Email us at [email protected].
Related Consulting Presentations
These presentations below are available for individual purchase from Flevy , the marketplace for business best practices.

Slide Customization & Production
We provide tailored slide customization and production services:
- Conversion of scanned notes into PowerPoint slides
- Development of PowerPoint master template
- Creation of data-driven PowerPoint charts from hand-drawn graphs
- Conversion of Excel charts to PowerPoint charts
- Conversion of other file formats (e.g. PDF, TIF, Word Doc) to PowerPoint slides
- Conversion of PowerPoint slides from one master template to another
- Visual enhancement of existing PowerPoint presentations to increase the professional look of the presentation