
Why This Slide Is Useful
This slide is valuable for senior executives, strategy consultants, and investment professionals assessing solar project viability and sustainability. It consolidates critical metrics that demonstrate financial returns, capacity growth, efficiency, and environmental benefits, enabling informed decision-making and stakeholder communication.
For C-level leaders and portfolio managers, understanding these KPIs supports strategic planning around solar investments, especially in evaluating project success and ESG compliance. The benchmarks offer context for performance relative to industry standards, helping identify areas for improvement or further investment.
Management consultants and advisors can leverage this slide to structure client discussions on solar project performance. It provides a clear framework for evaluating operational efficiency, environmental impact, and financial viability, which are essential for guiding project optimization or due diligence.
Furthermore, this slide facilitates stakeholder transparency by presenting complex performance data in an accessible format. It supports reporting to investors, regulators, or internal teams, ensuring alignment on project goals and progress toward sustainability targets.
How This Slide Is Used
This slide is typically used during project review meetings, investor presentations, or ESG reporting sessions. It serves as a reference point for discussing project performance, benchmarking against industry standards, and identifying gaps or opportunities for improvement.
In investment analysis, this KPI dashboard helps portfolio managers evaluate the success of solar assets, especially when considering new acquisitions or divestments. It provides a quick overview of operational health and environmental contributions, supporting data-driven decisions.
Consultants often customize this slide to highlight specific KPIs relevant to client objectives, such as capacity growth or emissions avoided. It can be integrated into broader strategic frameworks or sustainability reports to demonstrate project impact and progress.
Organizations also utilize this slide in regulatory or compliance reporting, where demonstrating environmental benefits and operational efficiency is required. It simplifies complex data into a digestible format for diverse stakeholders, including non-technical audiences.
Related PPT Slides

Tracking Reserve and Carbon Metrics PPT Slide
This slide details key performance indicators (KPIs) used to measure long-term sustainability and operational efficiency in oil and gas companies. It provides definitions, importance, and benchmarking data for each metric, supporting strategic decision-making and performance tracking in energy sector organizations.
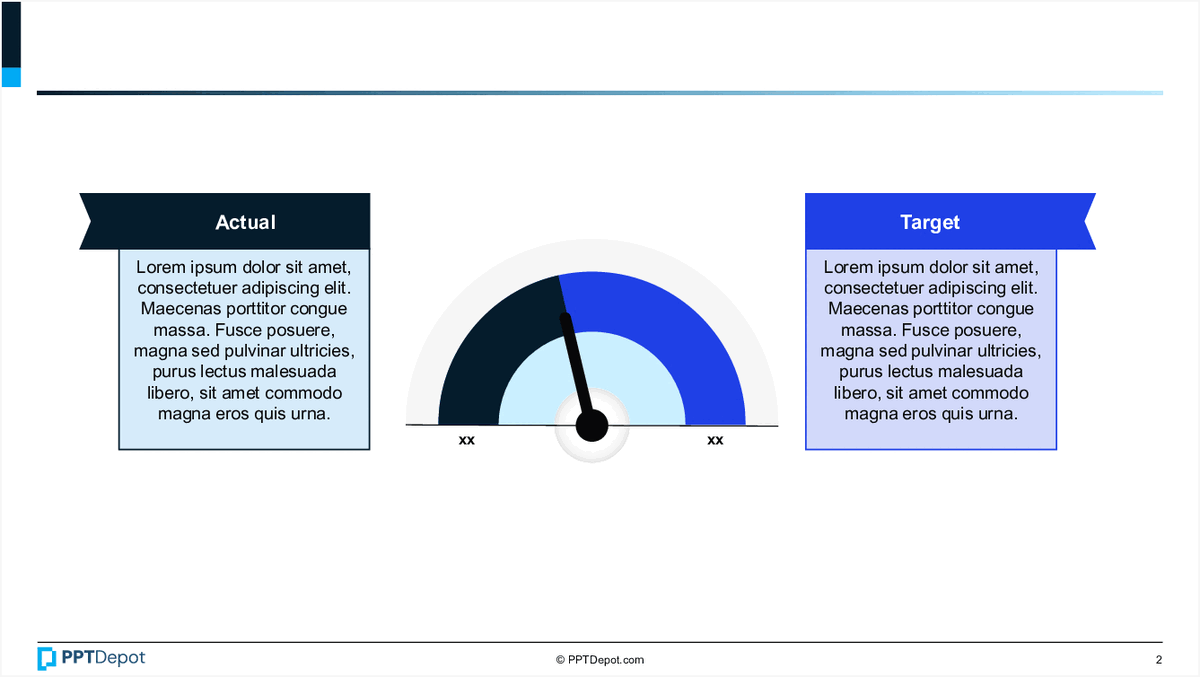
Performance Gap Analysis Dashboard PPT Slide
This slide illustrates a performance measurement framework using a gauge chart to compare actual versus target metrics. It visually highlights the gap between current performance and desired outcomes, supported by descriptive text boxes that provide context for both data points. The layout is designed for quick assessment and strategic decision-making at the executive level.

AgriTech KPIs for Crop Yield, Emissions, and Regulatory Timelin PPT Slide
This slide outlines key performance indicators (KPIs) relevant to AgriTech, focusing on crop yield improvements, emissions reduction, and regulatory approval timelines. It provides clear definitions, importance, and benchmark targets for each KPI, serving as a strategic measurement framework for operational and strategic decision-making in the sector.

Vertical Opportunities in Oil & Gas PPT Slide
This slide highlights the growth potential across various segments within the oil and gas industry, emphasizing areas like upstream exploration, midstream transportation, downstream refining, and petrochemicals. It provides a snapshot of industry verticals with brief descriptions of each segment's role and significance in the evolving energy landscape.

Environmental Factors Impacting Agriculture PPT Slide
This slide analyzes key political, economic, social, technological, legal, and environmental factors shaping the agricultural sector. It highlights specific trends and data points within each category, illustrating how these external forces influence innovation, strategy, and adoption in the industry. The structured format provides a comprehensive view for decision-makers assessing sector risks and opportunities.

Benchmarking Critical Success Factors PPT Slide
This slide displays a comparative analysis of nine critical success factors across nine competitors, including the organization itself. It uses a visual format to highlight strengths, weaknesses, and strategic gaps by illustrating how each factor performs relative to competitors, enabling quick identification of areas needing improvement or differentiation.
Explore Slides by Tags

Download our FREE collection of over 50+ high-impact, fully editable PowerPoint templates. These professional templates cover a comprehensive range of strategic analysis frameworks—including Strategy Formulation, Innovation, Digital Transformation, Change Management, and many others—ideal for Management Consultants, Investment Bankers, Strategy Professionals, and Business Executives.
Trusted by Leading Global Organizations
Our templates are trusted by thousands of organizations worldwide, including leading brands such as those listed below.
Related Templates from PPT Depot


Leverage our domain and design expertise. Become a subscriber today:
Each presentation is available in 3 color schemes. Download the version that most fits your firm's branding and customize it further once you download the PPTX file.


![]()
PPT Depot is your subscription to high-impact management consulting and investment banking templates—crafted from real-world deliverables by ex-MBB consultants and designed by former McKinsey Visual Graphics (VGI) presentation specialists. Compare plans here to determine what's the best fit for your firm.
With 15 years of experience, the team behind PPT Depot has empowered over 500+ clients across over 30+ countries. We currently produce 200,000 slides annually.
PPT Depot releases new templates each week. We have management topic-focused templates (e.g. market analysis, strategic planning, digital transformation, and more), alongside industry-specific collections. Peruse our full inventory here.
Save time and effort—elevate your presentations with proven domain and design expertise.
Got a question? Email us at [email protected].
Related Consulting Presentations
These presentations below are available for individual purchase from Flevy , the marketplace for business best practices.

Slide Customization & Production
We provide tailored slide customization and production services:
- Conversion of scanned notes into PowerPoint slides
- Development of PowerPoint master template
- Creation of data-driven PowerPoint charts from hand-drawn graphs
- Conversion of Excel charts to PowerPoint charts
- Conversion of other file formats (e.g. PDF, TIF, Word Doc) to PowerPoint slides
- Conversion of PowerPoint slides from one master template to another
- Visual enhancement of existing PowerPoint presentations to increase the professional look of the presentation