Why This Slide Is Useful
This slide is useful because it consolidates complex market positioning data into a clear, visual format that enables quick assessment of competitive threats and opportunities. For C-level leaders and strategic decision-makers, it provides insights into which companies are expanding rapidly and which hold dominant market shares, informing investment and partnership considerations.
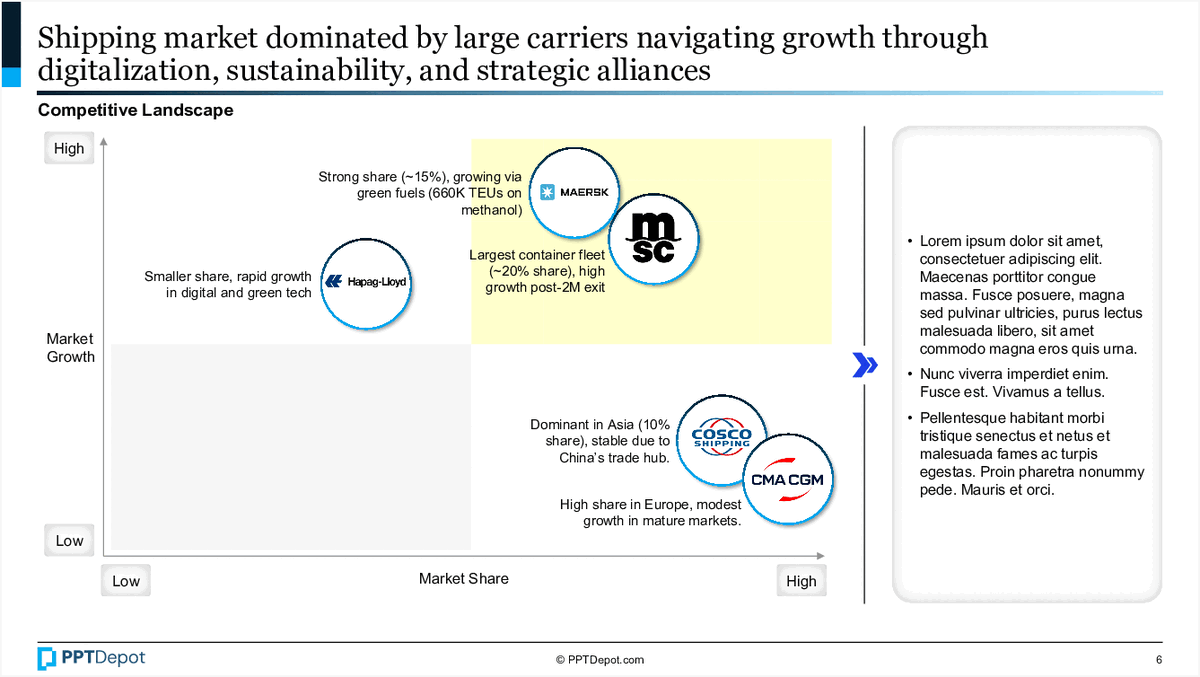
The placement of each company on the matrix helps identify emerging leaders versus established players. For example, Maersk and MSC are positioned as large, high-growth entities, signaling their potential to shape industry trends. Conversely, companies like COSCO and CMA CGM are shown with high market share, but modest growth, indicating stability in mature markets.
This visualization supports strategic discussions around market entry, expansion, or consolidation. It helps executives prioritize resources by understanding where the most growth is occurring and which competitors are investing heavily in green fuels or fleet expansion. The annotations about fleet size and growth post-2M exit provide additional context for assessing future industry shifts.
Furthermore, the slide can be used to benchmark a company's position relative to competitors. By comparing internal growth targets with the external landscape, leadership can identify gaps or areas for strategic focus. It also serves as a foundation for scenario planning, such as evaluating potential impacts of new alliances or technological innovations in the shipping industry.
How This Slide Is Used
This slide is typically employed during strategic planning sessions, industry analysis, or competitive benchmarking exercises. Executives and strategists use it to map out the current landscape and identify where their company stands relative to rivals.
In consulting engagements, this slide often forms part of a broader market entry or growth strategy. For example, a client considering expansion into Asia might analyze the positioning of COSCO and CMA CGM to understand regional dominance and growth prospects. The visual cues help frame discussions around potential partnerships or acquisitions.
Investment teams and private equity firms leverage this slide to assess industry consolidation opportunities. The positioning of MSC and Maersk as high-growth, large-scale operators suggests areas where investment could accelerate or where competitive pressures are intensifying.
Operational leaders may also use this slide to inform fleet investment decisions or green fuel adoption strategies. The annotations about fleet size and growth trends provide context for planning capital expenditures or technological upgrades aligned with industry shifts. Overall, it acts as a strategic compass for navigating a complex and evolving market landscape.
Related PPT Slides
Industrial and Data Center Growth PPT Slide
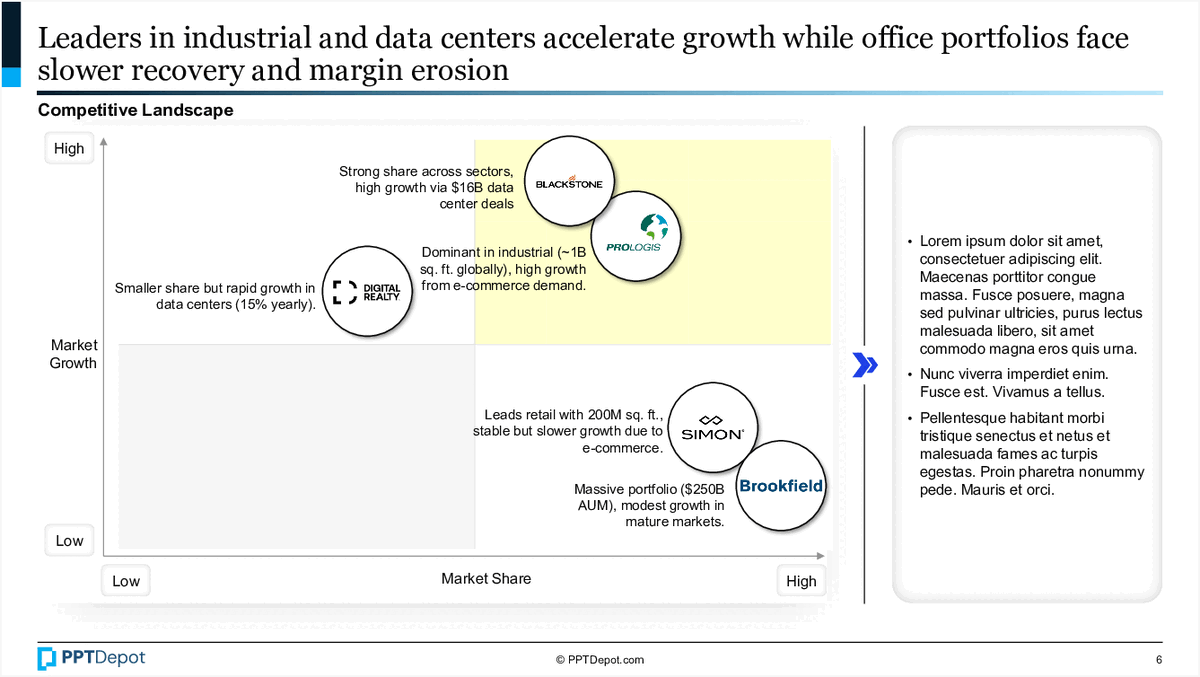
This slide compares the growth prospects of leaders in industrial and data centers within a competitive landscape. It visualizes market share and growth potential, highlighting how different companies are positioned based on their market share and industry dynamics. The layout aids in quickly assessing which firms are gaining traction and where opportunities or risks may lie.

AgriTech Industry SWOT Analysis PPT Slide
This slide provides a SWOT analysis of the AgriTech industry, highlighting key strengths, weaknesses, opportunities, and threats. It summarizes critical factors influencing industry growth, innovation, and regulatory environment, offering a strategic snapshot for decision-makers and investors.
Global EV OEM Market Share PPT Slide
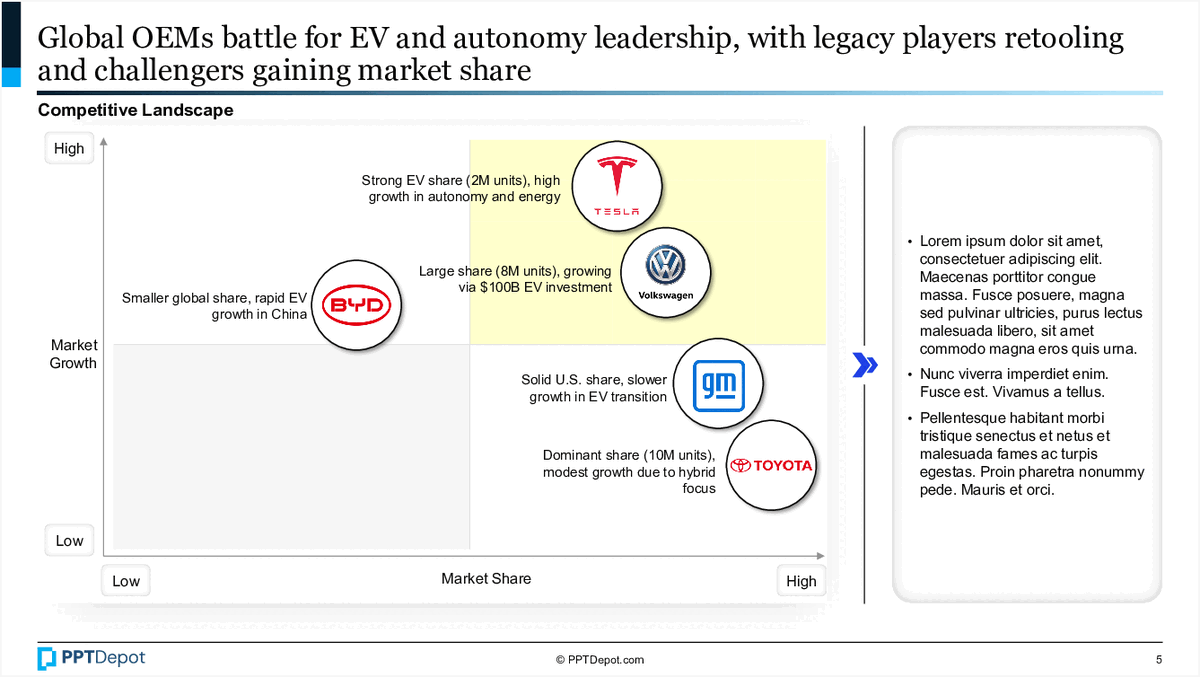
This slide illustrates the competitive positioning of major automotive manufacturers within the electric vehicle (EV) market, focusing on market share and growth trajectories. It visualizes how legacy automakers and new entrants are gaining or consolidating market share, highlighting their strategic focus on EV leadership and investment levels. The chart provides a snapshot of the evolving landscape, useful for strategic assessment and competitive benchmarking.

Capability Comparison Matrix PPT Slide
This slide displays a visual comparison of ten key capabilities across ten competitors, including the company's own performance. It uses pie charts within a grid to illustrate the relative strength or weakness of each capability for each entity, enabling quick benchmarking and gap analysis at a glance.
Biotech Competitive Landscape PPT Slide
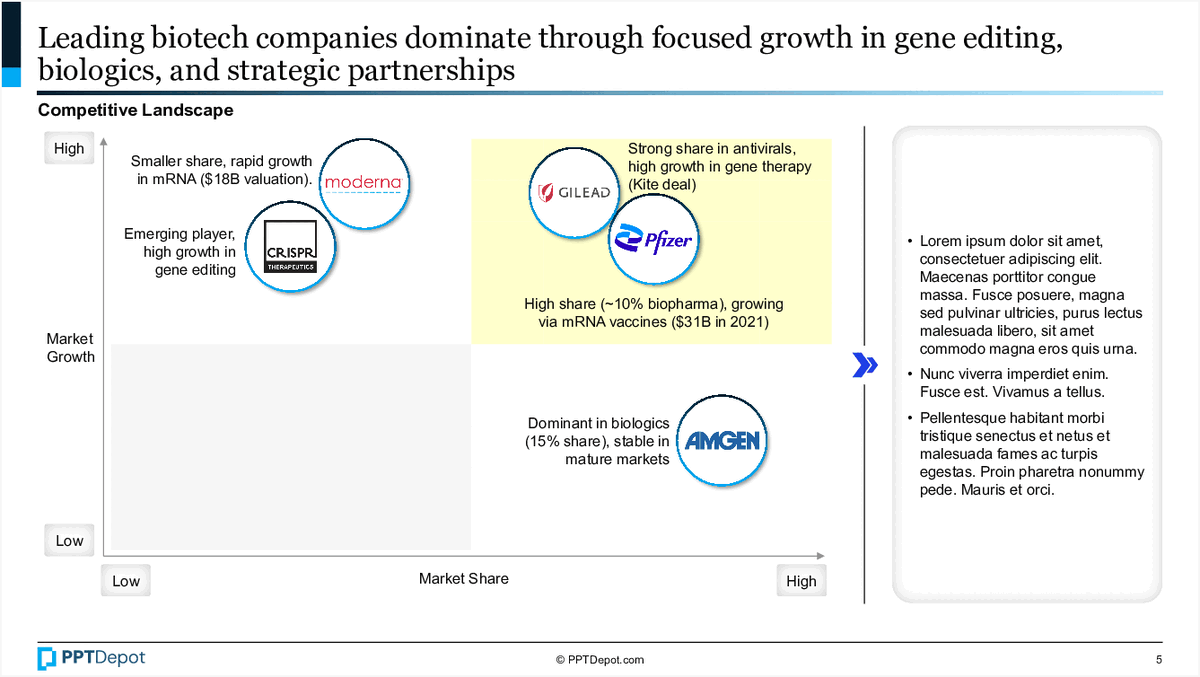
This slide illustrates the competitive positioning of leading biotech companies based on market share and market growth. It visualizes how firms like Moderna, Gilead, Pfizer, CRISPR Therapeutics, and Amgen are situated within the landscape, highlighting their strategic focus areas such as gene editing, biopharma, and antiviral markets. The chart provides a quick reference for assessing market dynamics and company strengths in the sector.

FinTech Industry SWOT Analysis PPT Slide
This slide provides a SWOT analysis of the FinTech industry, highlighting its key strengths, weaknesses, opportunities, and threats. It consolidates critical market data and strategic insights to inform decision-making for executives, investors, and consultants involved in financial technology sectors.
Explore Slides by Tags

Download our FREE collection of over 50+ high-impact, fully editable PowerPoint templates. These professional templates cover a comprehensive range of strategic analysis frameworks—including Strategy Formulation, Innovation, Digital Transformation, Change Management, and many others—ideal for Management Consultants, Investment Bankers, Strategy Professionals, and Business Executives.
Trusted by Leading Global Organizations
Our templates are trusted by thousands of organizations worldwide, including leading brands such as those listed below.
Related Templates from PPT Depot


Leverage our domain and design expertise. Become a subscriber today:
Each presentation is available in 3 color schemes. Download the version that most fits your firm's branding and customize it further once you download the PPTX file.


![]()
PPT Depot is your subscription to high-impact management consulting and investment banking templates—crafted from real-world deliverables by ex-MBB consultants and designed by former McKinsey Visual Graphics (VGI) presentation specialists. Compare plans here to determine what's the best fit for your firm.
With 15 years of experience, the team behind PPT Depot has empowered over 500+ clients across over 30+ countries. We currently produce 200,000 slides annually.
PPT Depot releases new templates each week. We have management topic-focused templates (e.g. market analysis, strategic planning, digital transformation, and more), alongside industry-specific collections. Peruse our full inventory here.
Save time and effort—elevate your presentations with proven domain and design expertise.
Got a question? Email us at [email protected].
Related Consulting Presentations
These presentations below are available for individual purchase from Flevy , the marketplace for business best practices.

Slide Customization & Production
We provide tailored slide customization and production services:
- Conversion of scanned notes into PowerPoint slides
- Development of PowerPoint master template
- Creation of data-driven PowerPoint charts from hand-drawn graphs
- Conversion of Excel charts to PowerPoint charts
- Conversion of other file formats (e.g. PDF, TIF, Word Doc) to PowerPoint slides
- Conversion of PowerPoint slides from one master template to another
- Visual enhancement of existing PowerPoint presentations to increase the professional look of the presentation