Why This Slide Is Useful
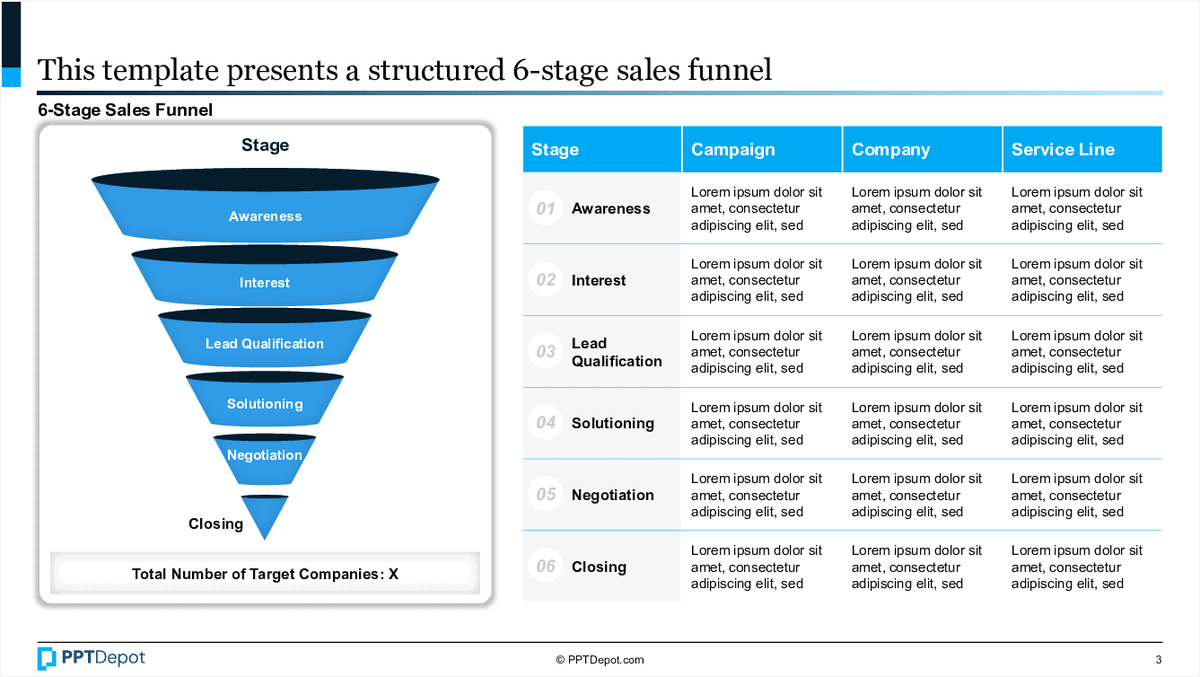
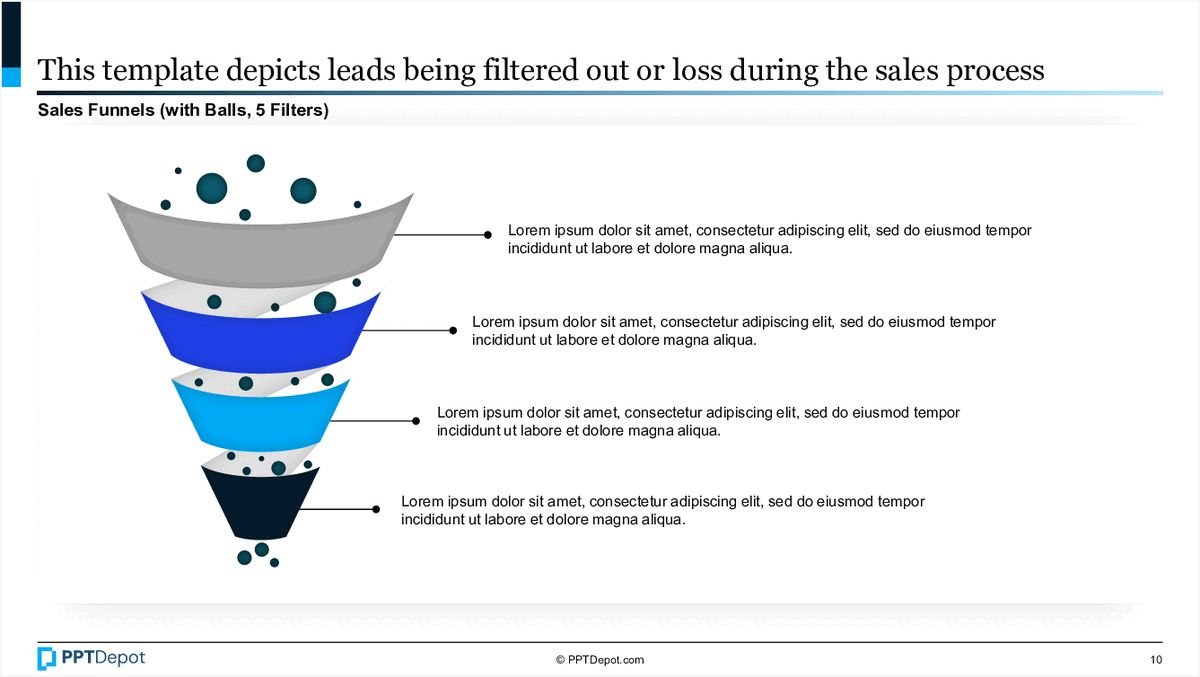
This slide is useful because it provides a clear visual representation of how leads move through different stages of a sales process, including where potential drop-offs occur. For management consultants and sales strategists, it offers a straightforward way to diagnose bottlenecks or inefficiencies in a client’s sales pipeline. The segmented funnel format makes it easy to communicate complex lead flow dynamics in a concise manner, especially during client workshops or strategic reviews.
For C-level executives, this slide delivers a high-level overview of sales performance and pipeline health. It helps prioritize resource allocation or process improvements by pinpointing stages with significant lead attrition. The visual simplicity supports decision-making by translating detailed data into an intuitive format that can be quickly grasped by stakeholders.
In consulting engagements, this funnel can be customized with actual data to track progress over time or compare different sales teams. It serves as a diagnostic tool to identify where interventions are needed, whether through training, process adjustments, or technology enhancements. The clear segmentation also facilitates targeted discussions on how to optimize each stage for better conversion rates.
Furthermore, the slide can be integrated into broader sales or marketing dashboards, providing a snapshot of lead filtering effectiveness. It supports ongoing monitoring and continuous improvement efforts by visualizing the impact of strategic initiatives aimed at reducing lead loss and increasing overall conversion rates.
How This Slide Is Used
This slide is typically used during sales performance reviews, pipeline analysis, or client presentations. Management consultants often employ it to assess the effectiveness of a client’s sales funnel and identify areas for process improvement. It can be used in workshops to facilitate discussions around lead management and conversion strategies.
In practice, the funnel is often populated with actual data, showing the number of leads at each stage and the attrition between them. This helps teams understand where most leads are lost and what interventions might be necessary to improve retention. For example, a client might discover that a significant number of leads drop off after the initial qualification stage, prompting targeted training or process changes.
The funnel visualization is also useful in scenario planning. Consultants can simulate the impact of different strategies—such as increasing lead qualification efficiency or shortening sales cycles—by adjusting the numbers within each segment. This supports data-driven decision-making and strategic planning.
In addition, this slide is frequently incorporated into broader dashboards or executive reports. It provides a quick, intuitive overview of sales health that can be easily updated as new data becomes available. This frequent use helps maintain focus on pipeline management as a core component of revenue growth strategies.
Related PPT Slides
This slide illustrates a structured sales funnel divided into 4 key stages: Awareness, Consideration, Decision, and Conversion. It combines a visual funnel diagram with a detailed table that maps each stage to specific campaign, company, and service line activities, providing a comprehensive view of the sales process for strategic review and planning.
This slide illustrates a sales funnel model segmented into 5 stages, each represented by a different colored section of the funnel. It emphasizes the filtering process that occurs at each stage, with placeholder text indicating where specific descriptions or metrics can be inserted. The visual layout supports quick comprehension of lead progression and attrition throughout the sales cycle.
Structured Sales Funnel Overview
This slide illustrates a five-stage sales funnel, visually represented by a funnel diagram alongside a detailed table. It outlines each stage—Awareness, Engagement, Qualification, Proposal, and Closing—paired with campaign, company, and service line specifics, providing a comprehensive view of the sales process for strategic review and planning.
This slide illustrates a structured sales funnel divided into 6 distinct stages, from awareness to closing. It combines a visual funnel diagram with a detailed table that outlines each stage's key activities across campaign, company, and service line contexts, providing a comprehensive view of the sales process for strategic review and planning.
This slide illustrates a sales funnel model segmented into 3 stages, visualized through a layered funnel graphic with accompanying placeholder text. It emphasizes the flow of leads through different filtering processes, highlighting how prospects are progressively narrowed down during the sales cycle. The design supports quick comprehension of sales pipeline dynamics for executive review.
Sales Funnel Filtering Criteria
This slide illustrates a sales funnel with 3 filtering stages, visually represented by a funnel diagram. It highlights the sequential narrowing of prospects through different criteria, accompanied by descriptive labels and a supporting text box for additional details. The layout emphasizes the progression from broad to specific segments within the sales process.
Explore Slides by Tags
Download our FREE collection of over 50+ high-impact, fully editable PowerPoint templates. These professional templates cover a comprehensive range of strategic analysis frameworks—including Strategy Formulation, Innovation, Digital Transformation, Change Management, and many others—ideal for Management Consultants, Investment Bankers, Strategy Professionals, and Business Executives.
Trusted by Leading Global Organizations
Our templates are trusted by thousands of organizations worldwide, including leading brands such as those listed below.
Related Templates from PPT Depot

Leverage our domain and design expertise. Become a subscriber today:
Each presentation is available in 3 color schemes. Download the version that most fits your firm's branding and customize it further once you download the PPTX file.


PPT Depot is your subscription to high-impact management consulting and investment banking templates—crafted from real-world deliverables by ex-MBB consultants and designed by former McKinsey Visual Graphics (VGI) presentation specialists. Compare plans here to determine what's the best fit for your firm.
With 15 years of experience, the team behind PPT Depot has empowered over 500+ clients across over 30+ countries. We currently produce 200,000 slides annually.
PPT Depot releases new templates each week. We have management topic-focused templates (e.g. market analysis, strategic planning, digital transformation, and more), alongside industry-specific collections. Peruse our full inventory here.
Save time and effort—elevate your presentations with proven domain and design expertise.
Got a question? Email us at [email protected].
Related Consulting Presentations
These presentations below are available for individual purchase from Flevy , the marketplace for business best practices.

Slide Customization & Production
We provide tailored slide customization and production services:
- Conversion of scanned notes into PowerPoint slides
- Development of PowerPoint master template
- Creation of data-driven PowerPoint charts from hand-drawn graphs
- Conversion of Excel charts to PowerPoint charts
- Conversion of other file formats (e.g. PDF, TIF, Word Doc) to PowerPoint slides
- Conversion of PowerPoint slides from one master template to another
- Visual enhancement of existing PowerPoint presentations to increase the professional look of the presentation


