Why This Slide Is Useful
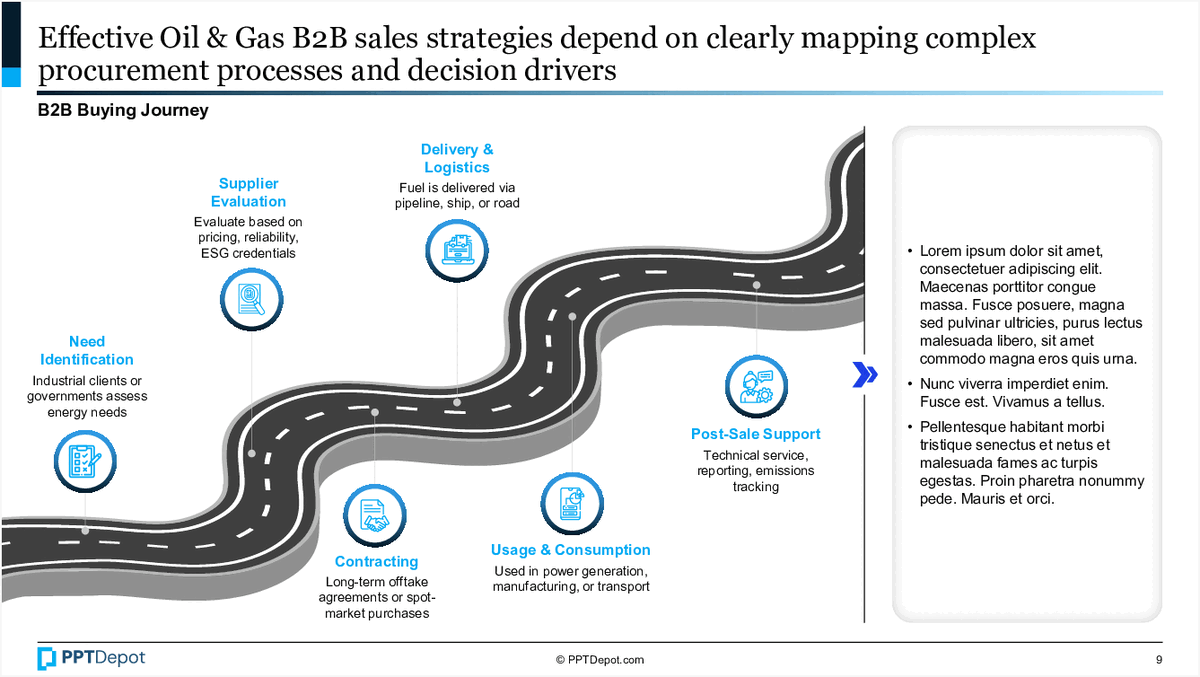
This slide is valuable for executives and strategic planners in the oil and gas sector because it distills a complex sales journey into a straightforward visual. It helps identify key decision points and drivers that influence procurement, enabling targeted interventions to accelerate sales cycles or improve client relationships. For senior leaders, understanding this process supports more effective resource allocation and strategic alignment with customer needs.
For sales and marketing teams, the slide offers a structured view of the customer journey, highlighting areas where engagement can be optimized. For example, focusing on early-stage need identification or post-sale support can influence overall sales success and customer satisfaction. It also underscores the importance of understanding procurement criteria like ESG credentials, which are increasingly critical in this industry.
Consultants working with oil and gas clients can leverage this framework to diagnose bottlenecks or gaps in the sales process. By mapping client-specific activities onto this generic journey, they can recommend tailored strategies to improve conversion rates or reduce cycle times. The visual nature of the slide makes it easy to communicate complex processes to diverse stakeholder groups, including technical teams and executive sponsors.
This slide can also serve as a foundation for developing sales enablement tools or training programs. By breaking down the journey into discrete, manageable steps, organizations can design targeted messaging, value propositions, and support mechanisms aligned with each phase. It supports a more disciplined approach to managing client relationships and driving revenue growth in a complex, relationship-driven industry.
How This Slide Is Used
This slide is typically used during sales strategy workshops, client engagement planning, or procurement process analysis. It helps sales teams and executives visualize the entire customer journey, enabling them to identify critical touchpoints and decision drivers. For example, a sales team might use this map to prepare tailored pitches for each stage, emphasizing ESG credentials during supplier evaluation or technical support during post-sale phases.
In consulting engagements, this framework assists in diagnosing where clients face challenges in closing deals or maintaining customer loyalty. Consultants can overlay client-specific data onto this map to pinpoint bottlenecks or gaps in the process. For instance, if clients struggle at the contract stage, recommendations might focus on streamlining negotiations or clarifying long-term agreements.
The slide also supports strategic planning for market entry or expansion efforts. By understanding the typical procurement journey, organizations can develop targeted marketing campaigns or sales initiatives that align with each phase. For example, early-stage activities might focus on establishing credibility through technical demonstrations or ESG credentials, while later stages emphasize value delivery and support.
Finally, this visual roadmap is useful in training sessions for sales and technical teams, ensuring everyone understands the sequence of activities and decision influences. It can be incorporated into CRM or sales enablement platforms to track progress and tailor engagement strategies, ultimately improving conversion rates and customer retention in the oil and gas industry.
Related PPT Slides
Supply Chain Procurement Process
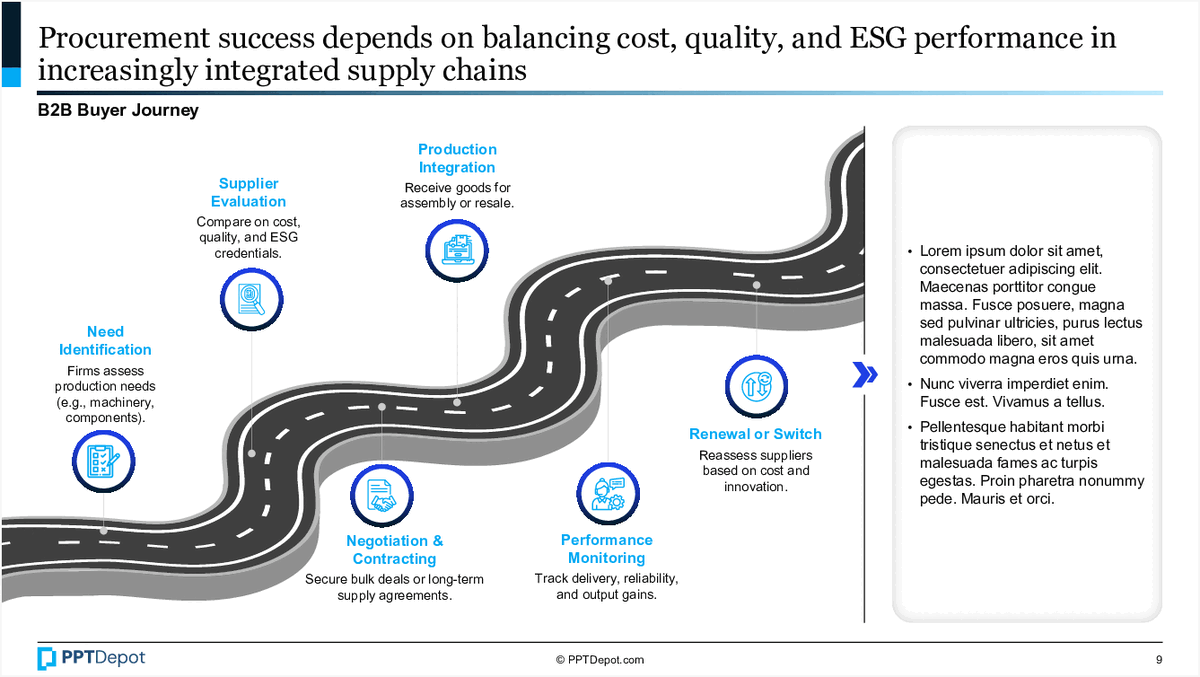
This slide illustrates the key stages involved in a B2B procurement journey within supply chains. It highlights the sequential steps from identifying needs to production integration, emphasizing the importance of balancing cost, quality, and ESG performance throughout the process. The visual layout underscores the interconnected nature of procurement activities and their impact on overall supply chain success.
EdTech Client Journey Overview
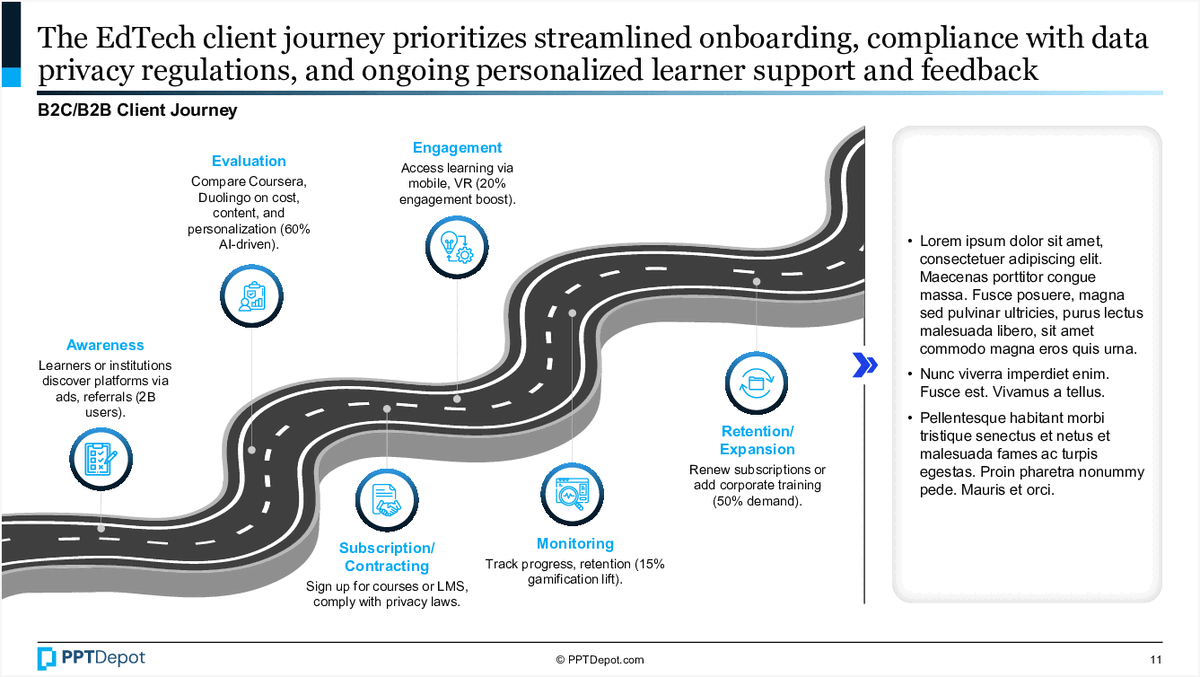
This slide maps the client journey in the EdTech sector, emphasizing key stages such as awareness, subscription, monitoring, engagement, and retention. It visually represents the progression through a winding road, with each phase supported by brief descriptions and icons, providing a clear framework for understanding client engagement dynamics.
This slide maps the typical FinTech client journey, highlighting key stages from awareness to usage and retention. It visually emphasizes the customer experience flow, with specific actions and touchpoints at each phase, supported by icons and brief descriptions. The layout aims to clarify how clients engage with FinTech services over time.
Client Engagement Process Stages
This slide illustrates a three-phase process for client engagement, mapped against a typical technology adoption curve. It highlights key milestones and target user groups at each stage, emphasizing the progression from initial assessment to strategic implementation. The visual layout supports strategic planning and stakeholder alignment for consulting or product teams.
Automotive Customer Journey Map
This slide depicts the typical stages of an automotive buyer's journey, illustrating how digital engagement, connected services, and brand loyalty evolve throughout the vehicle lifecycle. It visualizes key touchpoints from awareness to replacement, emphasizing the importance of integrated customer experiences in the automotive industry.
Business Continuity Management Disciplines
This slide illustrates the various disciplines that comprise the Business Continuity Management (BCM) umbrella, emphasizing their role in safeguarding organizational resilience. It visually segments core areas such as risk management, disaster recovery, and supply chain management, highlighting their interconnectedness within a comprehensive BCM framework.
Explore Slides by Tags
Download our FREE collection of over 50+ high-impact, fully editable PowerPoint templates. These professional templates cover a comprehensive range of strategic analysis frameworks—including Strategy Formulation, Innovation, Digital Transformation, Change Management, and many others—ideal for Management Consultants, Investment Bankers, Strategy Professionals, and Business Executives.
Trusted by Leading Global Organizations
Our templates are trusted by thousands of organizations worldwide, including leading brands such as those listed below.
Related Templates from PPT Depot

Leverage our domain and design expertise. Become a subscriber today:
Each presentation is available in 3 color schemes. Download the version that most fits your firm's branding and customize it further once you download the PPTX file.


PPT Depot is your subscription to high-impact management consulting and investment banking templates—crafted from real-world deliverables by ex-MBB consultants and designed by former McKinsey Visual Graphics (VGI) presentation specialists. Compare plans here to determine what's the best fit for your firm.
With 15 years of experience, the team behind PPT Depot has empowered over 500+ clients across over 30+ countries. We currently produce 200,000 slides annually.
PPT Depot releases new templates each week. We have management topic-focused templates (e.g. market analysis, strategic planning, digital transformation, and more), alongside industry-specific collections. Peruse our full inventory here.
Save time and effort—elevate your presentations with proven domain and design expertise.
Got a question? Email us at [email protected].
Related Consulting Presentations
These presentations below are available for individual purchase from Flevy , the marketplace for business best practices.

Slide Customization & Production
We provide tailored slide customization and production services:
- Conversion of scanned notes into PowerPoint slides
- Development of PowerPoint master template
- Creation of data-driven PowerPoint charts from hand-drawn graphs
- Conversion of Excel charts to PowerPoint charts
- Conversion of other file formats (e.g. PDF, TIF, Word Doc) to PowerPoint slides
- Conversion of PowerPoint slides from one master template to another
- Visual enhancement of existing PowerPoint presentations to increase the professional look of the presentation
