
Why This Slide Is Useful
This slide is valuable for senior executives and strategic planners seeking to understand competitive shifts within a market. It offers a straightforward visualization of how market shares are redistributed among key players, enabling leaders to identify emerging threats or opportunities. The comparison between 2 time points helps assess the effectiveness of current strategies and guides resource allocation.
For management teams, this slide supports scenario planning by revealing which competitors are gaining ground and which are losing share. It prompts questions about the underlying drivers—such as product innovation, pricing strategies, or customer loyalty—that influence these trends. This insight informs strategic pivots, M&A considerations, or investment priorities.
Consultants and investment analysts use this slide to evaluate market stability and identify potential disruptors. The visual format simplifies complex data, making it easier to communicate competitive positioning to clients or stakeholders. It also serves as a basis for developing targeted strategies to defend or expand market presence.
In addition, the slide can be integrated into broader market assessments or due diligence processes. By tracking shifts in market share, organizations can better understand industry trajectories and anticipate future competitive landscapes. This supports proactive decision-making and strategic agility in fast-changing markets.
How This Slide Is Used
This slide is typically used during strategic reviews, market entry assessments, or competitive benchmarking exercises. Leaders leverage it to communicate how their company’s position compares to rivals and to identify areas requiring strategic focus. It is often part of a broader presentation on market trends or growth opportunities.
In consulting engagements, this slide helps frame client discussions around competitive positioning. It can be customized to include additional context, such as revenue figures or segment-specific data, to deepen insights. The visual format makes it easy to highlight which competitors are gaining or losing share and why that matters.
The slide also supports scenario planning sessions, where teams simulate different strategic moves. For example, if a client plans to launch a new product, this slide can illustrate how that might impact their share relative to competitors over time. It provides a baseline for measuring the potential impact of strategic initiatives.
Furthermore, this slide is used in investor presentations or board reports to demonstrate market dynamics. It offers a quick snapshot of competitive health and potential risks, helping stakeholders understand the strategic landscape. The clear visual cues facilitate discussions on future positioning and resource prioritization.
Related PPT Slides

Market Share and Competitor Trends PPT Slide
This slide compares the market value shares of nine competitors between 2021 and 2025, illustrating how their positions are projected to shift over time. It combines a visual breakdown of individual share changes with a summarized table of competitors' compound annual growth rates (CAGR), providing a comprehensive view of market dynamics for strategic assessment.

Market Share Trend Analysis 2021-2025 PPT Slide
This slide compares the market share distribution of 3 competitors between 2021 and 2025, illustrating how their positions are projected to evolve over time. It uses a visual bar chart alongside a table to highlight changes in value share percentages and the overall market growth, providing a clear snapshot of competitive dynamics.

AI and Cloud Computing Market Landscape PPT Slide
This slide maps the competitive landscape of AI and cloud computing technology providers, highlighting their market share, growth potential, and strategic positioning. It visualizes key players such as Amazon, Google, Microsoft, NVIDIA, AMD, and emerging Chinese firms, emphasizing their relative dominance and innovation trajectories. The chart offers a quick snapshot of industry dynamics for strategic decision-making and investment considerations.

Market Share Trend Analysis 2021-2025 PPT Slide
This slide compares the market value shares of 3 competitors between 2021 and 2025, illustrating how their positions are projected to shift over time. It uses a visual bar chart to depict changes in market share percentages and a table to summarize the compound annual growth rate (CAGR) for each competitor, providing a clear view of market dynamics and competitive movements.

Industry Forces Lifecycle Dynamics PPT Slide
This slide illustrates how industry forces evolve through different lifecycle phases, from embryonic to decline. It aligns Porter’s Five Forces with industry stages, showing how each force's impact shifts over time. The visual emphasizes the changing nature of market dynamics and competitive pressures across the industry lifecycle.
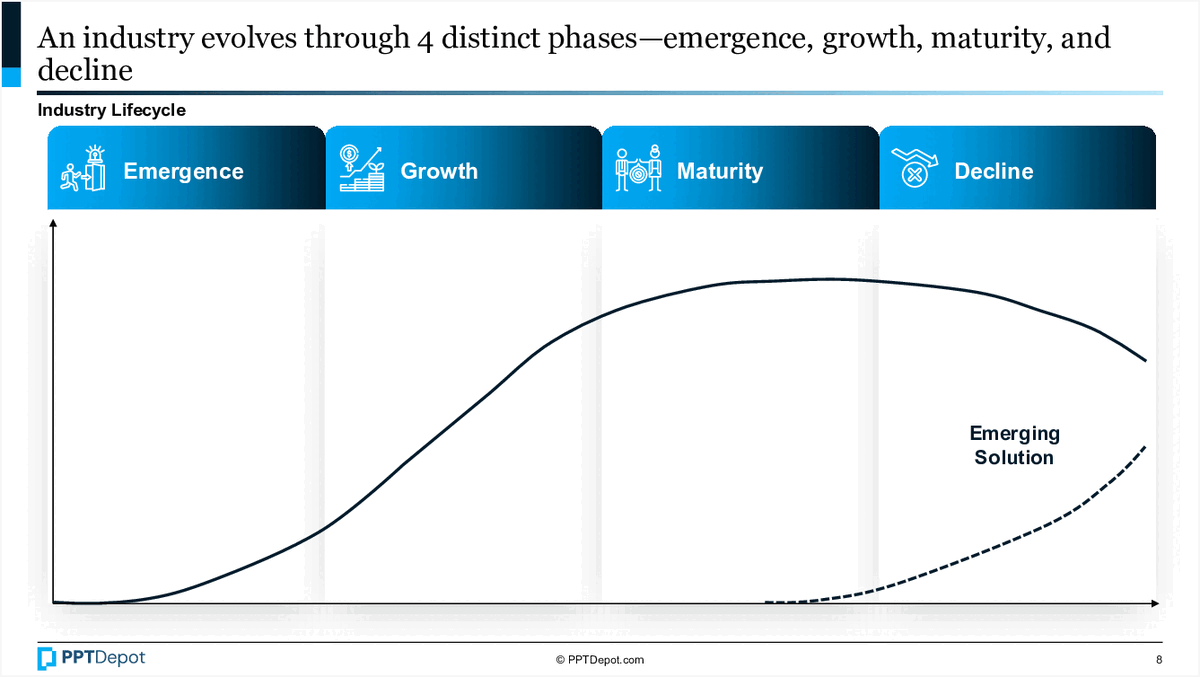
Industry Lifecycle Phases PPT Slide
This slide illustrates the 4 key phases of industry evolution: emergence, growth, maturity, and decline. It visualizes how industry performance typically progresses over time, highlighting the potential for new solutions to emerge during the decline phase. The chart provides a framework for understanding industry dynamics and timing strategic interventions.
Explore Slides by Tags


Download our FREE collection of over 50+ high-impact, fully editable PowerPoint templates. These professional templates cover a comprehensive range of strategic analysis frameworks—including Strategy Formulation, Innovation, Digital Transformation, Change Management, and many others—ideal for Management Consultants, Investment Bankers, Strategy Professionals, and Business Executives.
Trusted by Leading Global Organizations
Our templates are trusted by thousands of organizations worldwide, including leading brands such as those listed below.
Related Templates from PPT Depot


Leverage our domain and design expertise. Become a subscriber today:
Each presentation is available in 3 color schemes. Download the version that most fits your firm's branding and customize it further once you download the PPTX file.


![]()
PPT Depot is your subscription to high-impact management consulting and investment banking templates—crafted from real-world deliverables by ex-MBB consultants and designed by former McKinsey Visual Graphics (VGI) presentation specialists. Compare plans here to determine what's the best fit for your firm.
With 15 years of experience, the team behind PPT Depot has empowered over 500+ clients across over 30+ countries. We currently produce 200,000 slides annually.
PPT Depot releases new templates each week. We have management topic-focused templates (e.g. market analysis, strategic planning, digital transformation, and more), alongside industry-specific collections. Peruse our full inventory here.
Save time and effort—elevate your presentations with proven domain and design expertise.
Got a question? Email us at [email protected].
Related Consulting Presentations
These presentations below are available for individual purchase from Flevy , the marketplace for business best practices.

Slide Customization & Production
We provide tailored slide customization and production services:
- Conversion of scanned notes into PowerPoint slides
- Development of PowerPoint master template
- Creation of data-driven PowerPoint charts from hand-drawn graphs
- Conversion of Excel charts to PowerPoint charts
- Conversion of other file formats (e.g. PDF, TIF, Word Doc) to PowerPoint slides
- Conversion of PowerPoint slides from one master template to another
- Visual enhancement of existing PowerPoint presentations to increase the professional look of the presentation