
Why This Slide Is Useful
This slide is useful because it offers a clear, visual comparison of key players within the energy sector, emphasizing their relative market share and growth prospects. For C-level executives and strategists, it helps identify which companies are leading in innovation versus those maintaining steady, mature positions. This insight supports decision-making around potential partnerships, investments, or competitive threats.
For management consultants and industry analysts, the slide functions as a diagnostic tool to understand sector trends. It enables quick assessment of where each company stands in terms of growth and market dominance, informing strategic recommendations or client positioning. The visual cues—logos and quadrant placement—make complex industry data accessible and actionable.
The differentiation between high-growth potential and stable market share also guides resource allocation. Leaders can prioritize areas for innovation or consolidation based on a company’s position in this landscape. It further aids in scenario planning, such as evaluating how shifts toward renewables might impact traditional market leaders.
Finally, this slide supports strategic communication. It can be integrated into presentations for boardrooms or investor updates, illustrating competitive positioning with minimal explanation. The combination of visual simplicity and strategic depth makes it a versatile tool for multiple stakeholder conversations.
How This Slide Is Used
This slide is typically used during industry analysis, strategic planning, or competitive benchmarking sessions. It is often part of a broader market assessment where understanding the positioning of key players influences strategic decisions. For example, a company considering entering the renewables space might analyze this chart to identify potential partners or acquisition targets.
In consulting projects, this visual is customized to reflect specific client interests. A client aiming to defend its market share might focus on the quadrant with stable, mature companies like Saudi Aramco. Conversely, a client seeking growth opportunities might analyze the high-growth, high-share companies like Shell and ExxonMobil to understand their strategies.
The slide also serves as a basis for scenario modeling. For instance, if renewable investments accelerate, firms like Shell and TotalEnergies could shift quadrants, prompting strategic adjustments. It helps clients visualize how industry dynamics could evolve over time and plan accordingly.
In investor presentations, this slide succinctly communicates industry structure and competitive positioning. PE firms evaluating energy assets use it to identify which companies are positioned for growth or stability. It supports due diligence by highlighting market leaders and emerging players, guiding investment focus and risk assessment.
Related PPT Slides
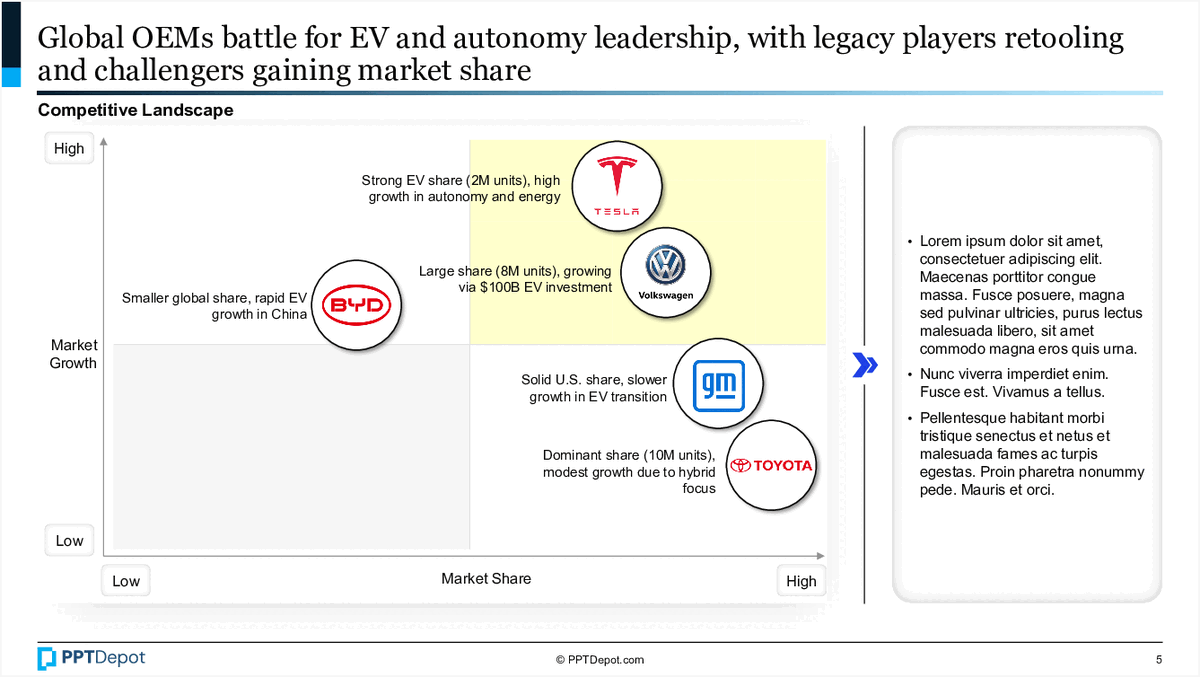
Global EV OEM Market Share PPT Slide
This slide illustrates the competitive positioning of major automotive manufacturers within the electric vehicle (EV) market, focusing on market share and growth trajectories. It visualizes how legacy automakers and new entrants are gaining or consolidating market share, highlighting their strategic focus on EV leadership and investment levels. The chart provides a snapshot of the evolving landscape, useful for strategic assessment and competitive benchmarking.
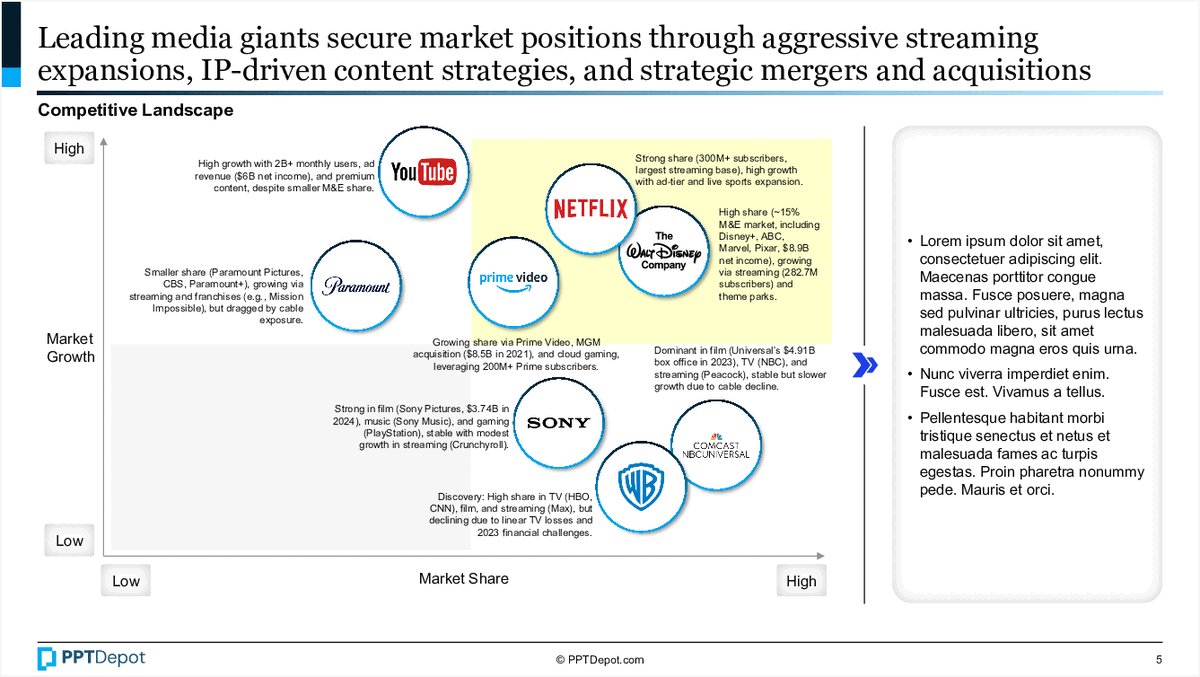
Media Giants Market Positioning PPT Slide
This slide illustrates the competitive landscape of leading media companies, mapping their market share against market growth. It highlights how major players like Netflix, YouTube, and Paramount are positioned in terms of market dominance and growth potential, providing a visual overview of industry dynamics for strategic assessment.

Industry Rivalry and Competitive Forces PPT Slide
This slide illustrates the key competitive forces shaping industry rivalry, including threats from new entrants, bargaining power of suppliers and buyers, and threats of substitutes. It uses a circular diagram to organize these forces around the central concept of industry rivalry, providing a structured view of competitive dynamics.

Biotech Industry Competitive Dynamics PPT Slide
This slide examines the key factors shaping competition within the biotech sector, focusing on innovation speed, entry barriers, supplier and buyer power, and substitute threats. It highlights how these elements influence industry rivalry and strategic positioning, providing a comprehensive view for executives and strategists assessing market challenges and opportunities.
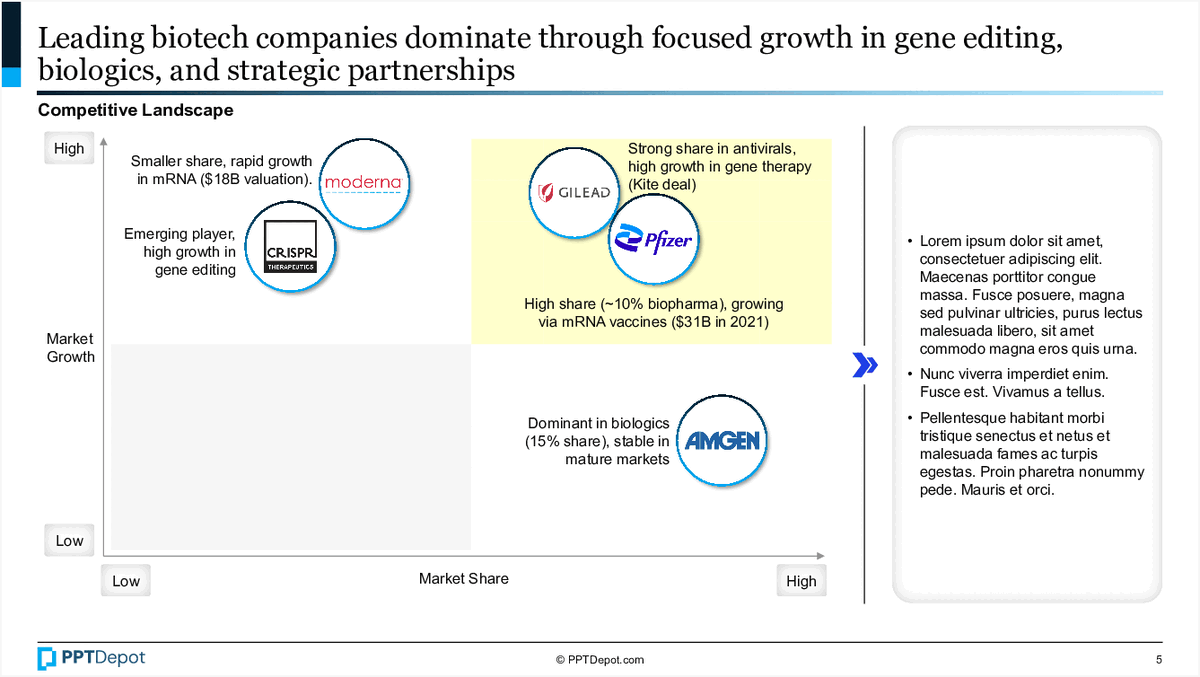
Biotech Competitive Landscape PPT Slide
This slide illustrates the competitive positioning of leading biotech companies based on market share and market growth. It visualizes how firms like Moderna, Gilead, Pfizer, CRISPR Therapeutics, and Amgen are situated within the landscape, highlighting their strategic focus areas such as gene editing, biopharma, and antiviral markets. The chart provides a quick reference for assessing market dynamics and company strengths in the sector.

Chemical Industry Competitive Pressures PPT Slide
This slide analyzes the competitive forces shaping the chemical industry, highlighting key threats and bargaining powers that influence market dynamics. It uses a circular diagram to depict the interconnected nature of industry rivalry, new entrants, suppliers, buyers, and substitutes, supported by specific data points and examples for each force.
Explore Slides by Tags


Download our FREE collection of over 50+ high-impact, fully editable PowerPoint templates. These professional templates cover a comprehensive range of strategic analysis frameworks—including Strategy Formulation, Innovation, Digital Transformation, Change Management, and many others—ideal for Management Consultants, Investment Bankers, Strategy Professionals, and Business Executives.
Trusted by Leading Global Organizations
Our templates are trusted by thousands of organizations worldwide, including leading brands such as those listed below.
Related Templates from PPT Depot


Leverage our domain and design expertise. Become a subscriber today:
Each presentation is available in 3 color schemes. Download the version that most fits your firm's branding and customize it further once you download the PPTX file.


![]()
PPT Depot is your subscription to high-impact management consulting and investment banking templates—crafted from real-world deliverables by ex-MBB consultants and designed by former McKinsey Visual Graphics (VGI) presentation specialists. Compare plans here to determine what's the best fit for your firm.
With 15 years of experience, the team behind PPT Depot has empowered over 500+ clients across over 30+ countries. We currently produce 200,000 slides annually.
PPT Depot releases new templates each week. We have management topic-focused templates (e.g. market analysis, strategic planning, digital transformation, and more), alongside industry-specific collections. Peruse our full inventory here.
Save time and effort—elevate your presentations with proven domain and design expertise.
Got a question? Email us at [email protected].
Related Consulting Presentations
These presentations below are available for individual purchase from Flevy , the marketplace for business best practices.

Slide Customization & Production
We provide tailored slide customization and production services:
- Conversion of scanned notes into PowerPoint slides
- Development of PowerPoint master template
- Creation of data-driven PowerPoint charts from hand-drawn graphs
- Conversion of Excel charts to PowerPoint charts
- Conversion of other file formats (e.g. PDF, TIF, Word Doc) to PowerPoint slides
- Conversion of PowerPoint slides from one master template to another
- Visual enhancement of existing PowerPoint presentations to increase the professional look of the presentation