Why This Slide Is Useful
This slide is valuable for senior management and strategy teams assessing market opportunities. It simplifies complex data into an intuitive visual, enabling quick identification of high-potential markets with strong synergies. This facilitates informed resource allocation and strategic focus, especially when considering market entry or expansion initiatives.
For consultants and strategic planners, the bubble chart offers a structured way to communicate market prioritization. It helps frame discussions around which markets warrant deeper analysis or immediate action, based on their position within the matrix. The size of bubbles can also highlight the relative scale of each opportunity, aiding in portfolio balancing.
Targeted at decision-makers involved in growth strategy, this slide supports scenario planning and trade-off analysis. By visualizing multiple markets simultaneously, executives can better understand the trade-offs between potential and effort, guiding more disciplined investment choices.
Furthermore, the chart’s layout allows for easy customization. Additional data points or labels can be integrated to reflect specific criteria such as competitive intensity or regulatory complexity. This flexibility makes it a practical tool for ongoing portfolio management and strategic review sessions.
How This Slide Is Used
This slide is typically used during strategic planning sessions, market assessments, or investment decision meetings. It serves as a visual aid to facilitate discussions about which markets to pursue or deprioritize, based on their attractiveness and the synergies they offer.
In consulting projects, the bubble chart is often customized with client-specific data. For example, a client may overlay their internal capabilities or competitive positioning onto the chart to identify gaps or areas for investment. It can also be used to compare multiple scenarios, such as organic growth versus acquisitions.
Investment teams and corporate development units leverage this slide to evaluate potential targets or new markets. By plotting opportunities on the matrix, they can quickly see which options align with strategic objectives and resource constraints. This visual approach streamlines decision-making processes and supports consensus-building.
Additionally, the slide is useful in stakeholder presentations, where it helps communicate complex market analyses in a straightforward manner. It can be integrated into broader strategic decks, supporting discussions around growth priorities, risk assessment, and resource deployment. The visual nature of the bubble chart makes it accessible for diverse audiences, from board members to operational teams.
Related PPT Slides

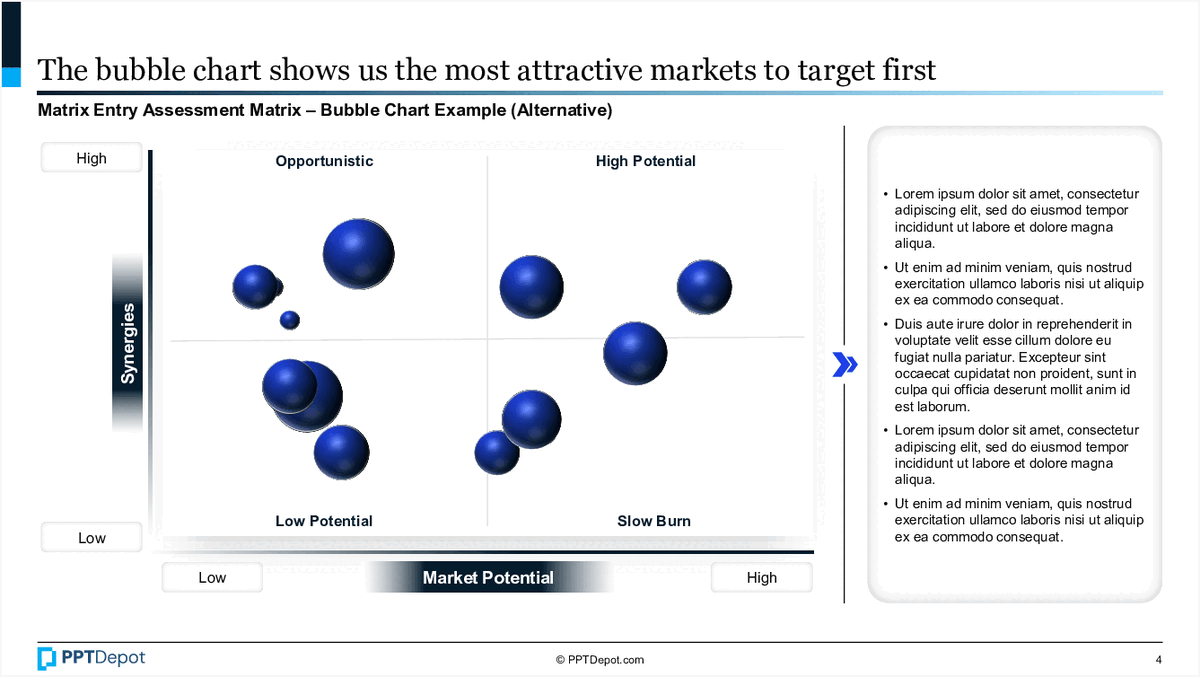
Market Attractiveness Bubble Chart PPT Slide
This slide illustrates a bubble chart assessing market attractiveness by plotting companies based on market potential and synergy opportunities. Each bubble represents a company, with size and position indicating relative market opportunity and potential for strategic fit, providing a visual prioritization tool for strategic decision-making.

Market Entry Assessment Matrix PPT Slide
This slide introduces a quadrant-based framework to evaluate market risk and opportunity, aiding strategic prioritization. It segments markets into 4 categories—High Potential, Opportunity/ Bolt-ons, Low Potential, and Slow Burn—based on their risk and potential, providing a visual tool for decision-making at the executive level.

Market and Build-Buy Complexity Analysis PPT Slide
This slide compares the complexity and viability of projects and market offerings through 2 key dimensions: impact versus application complexity and market maturity versus competitiveness. It visualizes how different types of projects and market decisions are positioned based on these factors, aiding strategic evaluation for investment or development priorities.
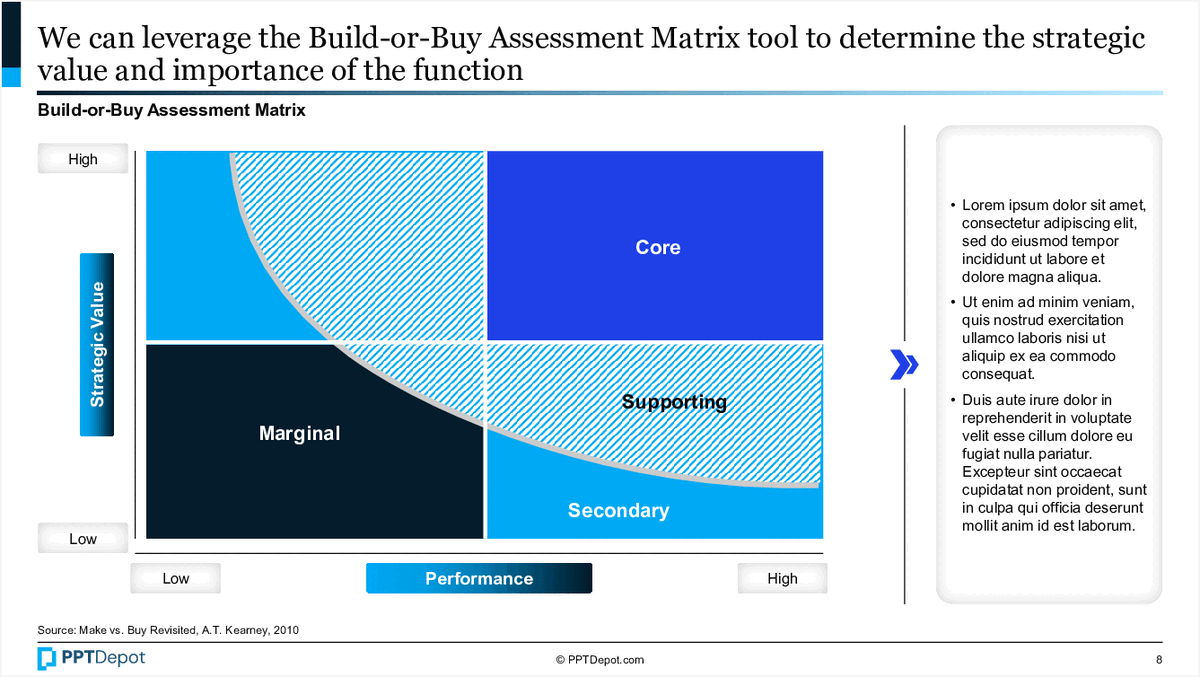
Build-or-Buy Assessment Matrix PPT Slide
This slide introduces the Build-or-Buy Assessment Matrix, a tool used to evaluate the strategic value and importance of different functions within an organization. It categorizes functions into core, supporting, secondary, and marginal segments based on their performance and strategic value, aiding decision-making on resource allocation and investment priorities.

Market Analysis Process Framework PPT Slide
This slide outlines a structured four-phase approach to conducting market analysis, emphasizing clarity and actionable insights. It visualizes each step with key questions to guide strategic evaluation—from defining the market to assessing competitive positioning—making it a practical tool for senior executives and consultants involved in market entry or growth strategies.
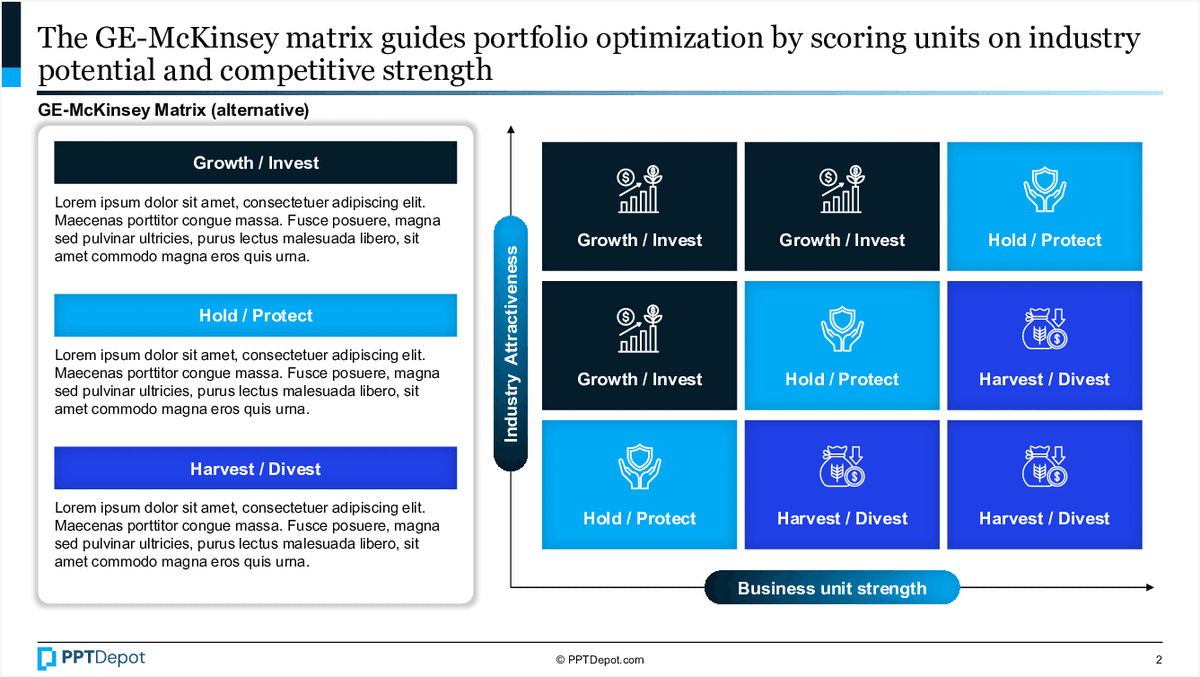
GE-McKinsey Portfolio Matrix PPT Slide
This slide illustrates the GE-McKinsey portfolio matrix, a strategic tool used to evaluate and prioritize business units based on industry attractiveness and business strength. It categorizes units into segments such as "Hold/Protect," "Grow/Invest," and "Harvest/Divest," providing a visual framework for resource allocation decisions at the corporate level.
Explore Slides by Tags

Download our FREE collection of over 50+ high-impact, fully editable PowerPoint templates. These professional templates cover a comprehensive range of strategic analysis frameworks—including Strategy Formulation, Innovation, Digital Transformation, Change Management, and many others—ideal for Management Consultants, Investment Bankers, Strategy Professionals, and Business Executives.
Trusted by Leading Global Organizations
Our templates are trusted by thousands of organizations worldwide, including leading brands such as those listed below.
Related Templates from PPT Depot


Leverage our domain and design expertise. Become a subscriber today:
Each presentation is available in 3 color schemes. Download the version that most fits your firm's branding and customize it further once you download the PPTX file.


![]()
PPT Depot is your subscription to high-impact management consulting and investment banking templates—crafted from real-world deliverables by ex-MBB consultants and designed by former McKinsey Visual Graphics (VGI) presentation specialists. Compare plans here to determine what's the best fit for your firm.
With 15 years of experience, the team behind PPT Depot has empowered over 500+ clients across over 30+ countries. We currently produce 200,000 slides annually.
PPT Depot releases new templates each week. We have management topic-focused templates (e.g. market analysis, strategic planning, digital transformation, and more), alongside industry-specific collections. Peruse our full inventory here.
Save time and effort—elevate your presentations with proven domain and design expertise.
Got a question? Email us at [email protected].
Related Consulting Presentations
These presentations below are available for individual purchase from Flevy , the marketplace for business best practices.

Slide Customization & Production
We provide tailored slide customization and production services:
- Conversion of scanned notes into PowerPoint slides
- Development of PowerPoint master template
- Creation of data-driven PowerPoint charts from hand-drawn graphs
- Conversion of Excel charts to PowerPoint charts
- Conversion of other file formats (e.g. PDF, TIF, Word Doc) to PowerPoint slides
- Conversion of PowerPoint slides from one master template to another
- Visual enhancement of existing PowerPoint presentations to increase the professional look of the presentation