Why This Slide Is Useful
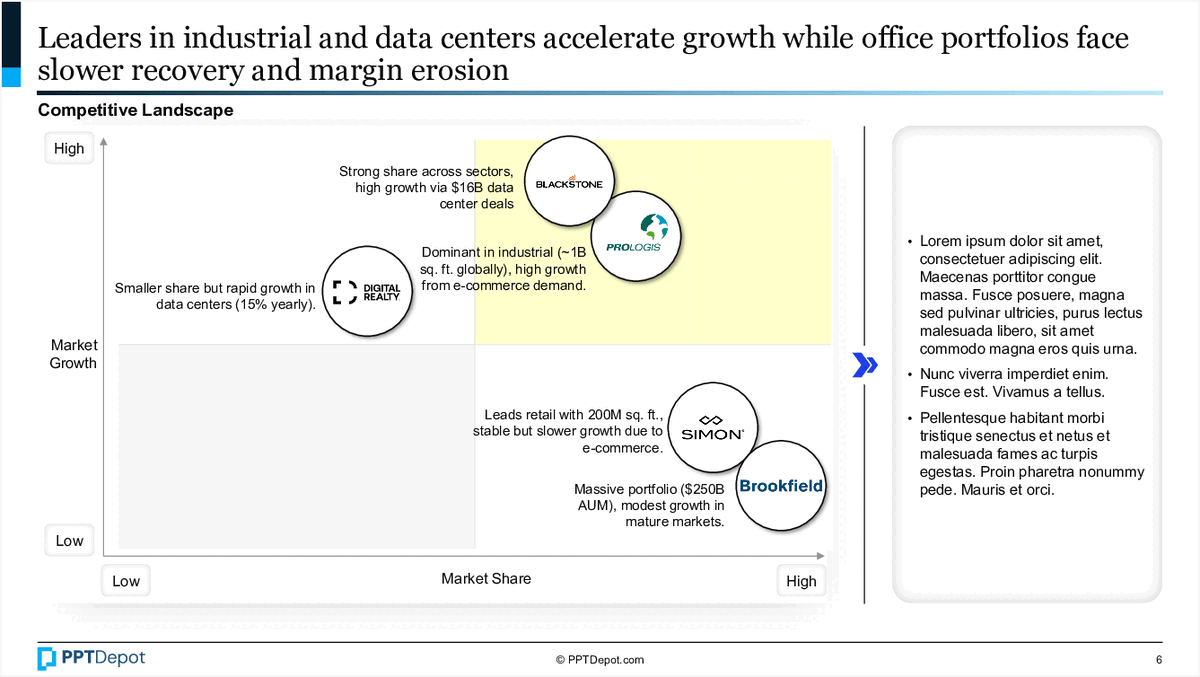
This slide is useful because it provides a clear visual summary of how key players in industrial and data center sectors are performing and evolving. For management teams and strategic planners, it highlights which companies are leading in growth and market share, enabling targeted investment or partnership decisions. It also underscores the importance of sector-specific dynamics, such as high growth via data center deals or dominance in e-commerce demand, which are critical for shaping strategic priorities.
For executives, especially those in corporate development or portfolio management, this slide offers a snapshot of industry positioning. It helps identify potential acquisition targets or competitors that are gaining market share or expanding rapidly. The visual cues—such as bubble size and position—quickly communicate relative strength and growth trajectory, supporting faster decision-making.
Consultants and investors can leverage this slide to understand sector trends and competitive pressure. It serves as a foundation for deeper analysis, such as evaluating the sustainability of growth or the impact of market share shifts. The annotations and company labels guide discussions around strategic focus areas, investment opportunities, or risk mitigation strategies.
This slide also supports scenario planning by illustrating where market growth is concentrated and which companies are best positioned to capitalize on emerging trends. It encourages a data-driven approach to resource allocation, emphasizing sectors and firms with the most promising outlooks based on current positioning and growth signals.
How This Slide Is Used
This slide is typically used during strategic review sessions, industry analysis, or competitive assessments. Management teams rely on it to understand the positioning of industry leaders and identify potential areas for expansion or divestment. It is especially useful in quarterly or annual strategic planning meetings to visualize shifts in market dynamics.
In consulting engagements, this visual is often customized with additional data points, such as revenue figures or growth rates, to deepen insights. For example, a client might overlay their own company’s position to benchmark against competitors or identify gaps in their market coverage. The bubble chart format makes it easy to compare multiple variables simultaneously.
Investors and PE firms use this slide to evaluate the attractiveness of sectors or individual companies. It helps determine where to allocate capital based on growth potential and market share dominance. The visual cues assist in framing discussions around strategic fit, valuation, and future investment thesis.
In operational contexts, this slide supports resource prioritization. Companies may use it to decide where to focus sales efforts, R&D, or market entry strategies. The clear segmentation of high-growth versus mature markets guides tactical decisions and aligns teams around targeted growth initiatives.
Related PPT Slides
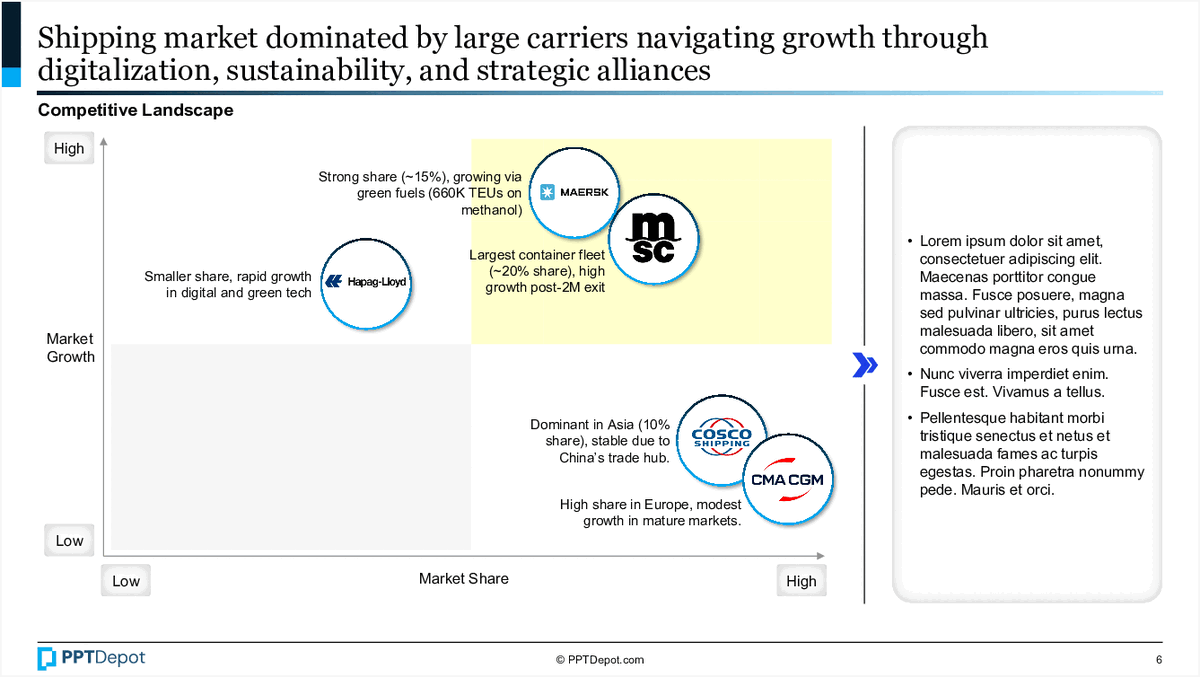
Shipping Market Competitive Landscape
This slide visualizes the competitive positioning of major shipping companies based on market share and growth potential. It highlights the size of their container fleets, market share, and growth trajectories within a strategic framework, aiding executives in understanding industry dynamics and key players' relative strengths.
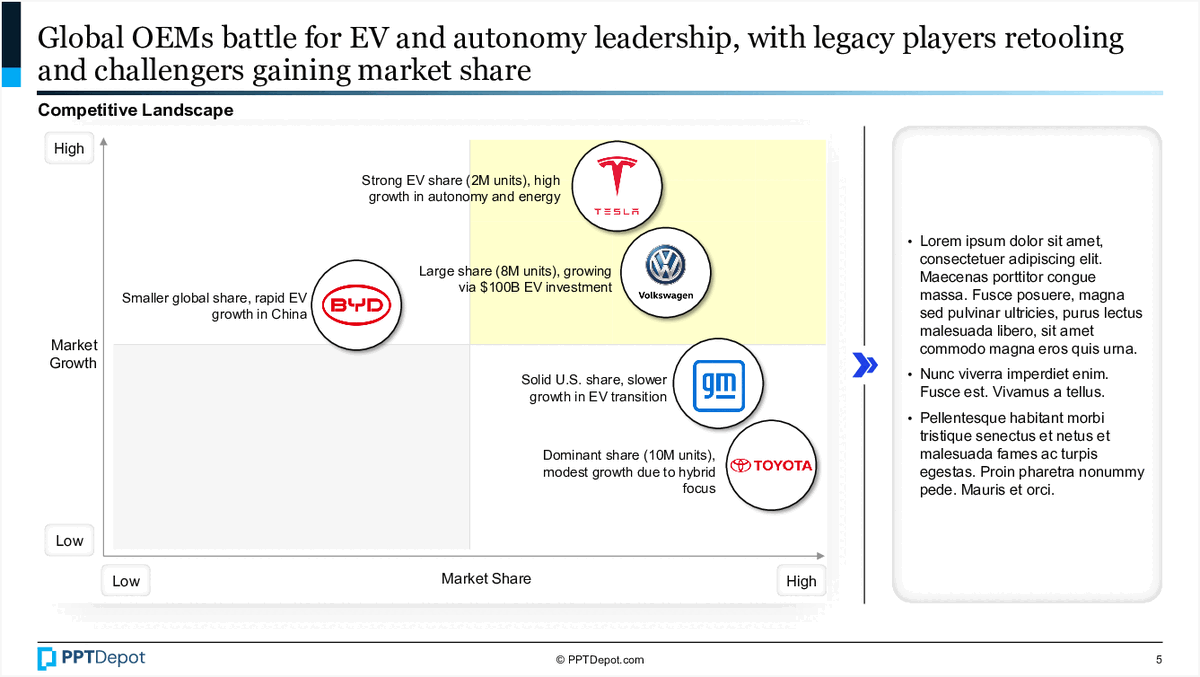
This slide illustrates the competitive positioning of major automotive manufacturers within the electric vehicle (EV) market, focusing on market share and growth trajectories. It visualizes how legacy automakers and new entrants are gaining or consolidating market share, highlighting their strategic focus on EV leadership and investment levels. The chart provides a snapshot of the evolving landscape, useful for strategic assessment and competitive benchmarking.
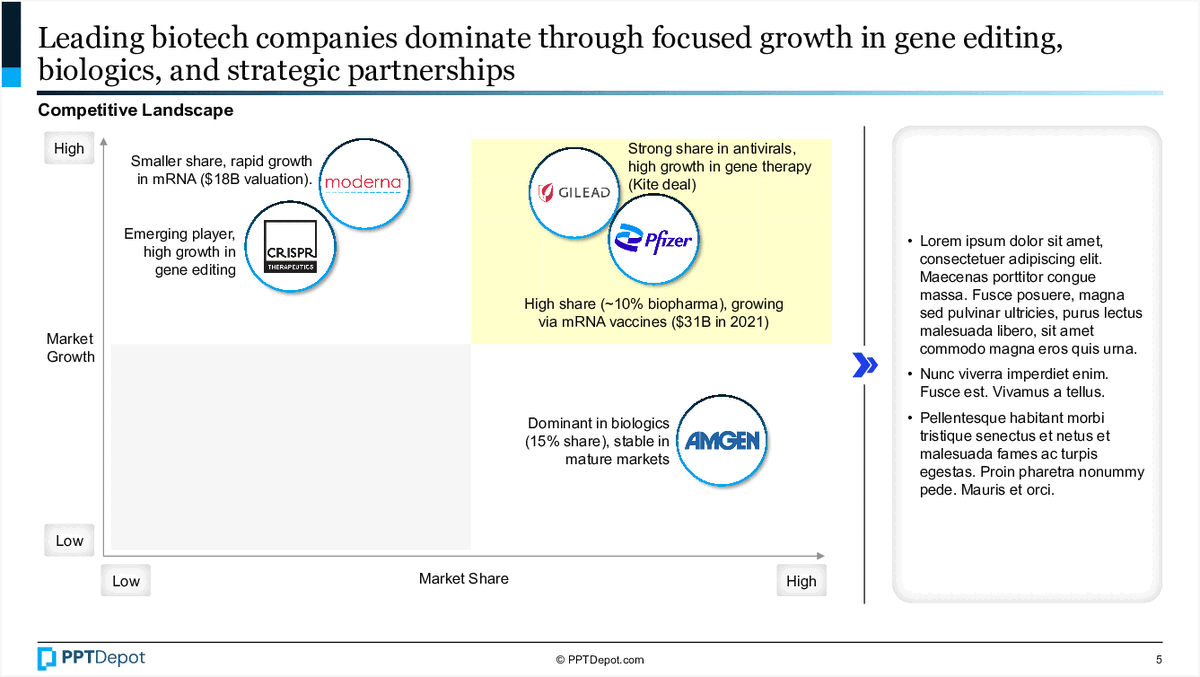
This slide illustrates the competitive positioning of leading biotech companies based on market share and market growth. It visualizes how firms like Moderna, Gilead, Pfizer, CRISPR Therapeutics, and Amgen are situated within the landscape, highlighting their strategic focus areas such as gene editing, biopharma, and antiviral markets. The chart provides a quick reference for assessing market dynamics and company strengths in the sector.
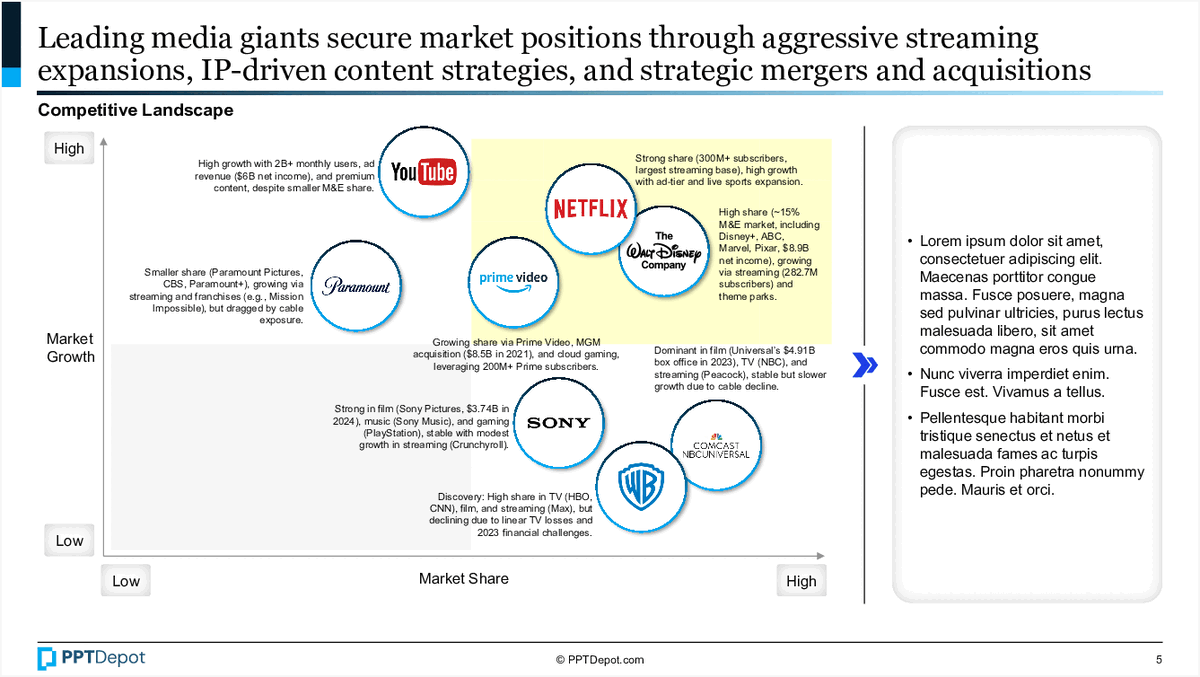
Media Giants Market Positioning
This slide illustrates the competitive landscape of leading media companies, mapping their market share against market growth. It highlights how major players like Netflix, YouTube, and Paramount are positioned in terms of market dominance and growth potential, providing a visual overview of industry dynamics for strategic assessment.
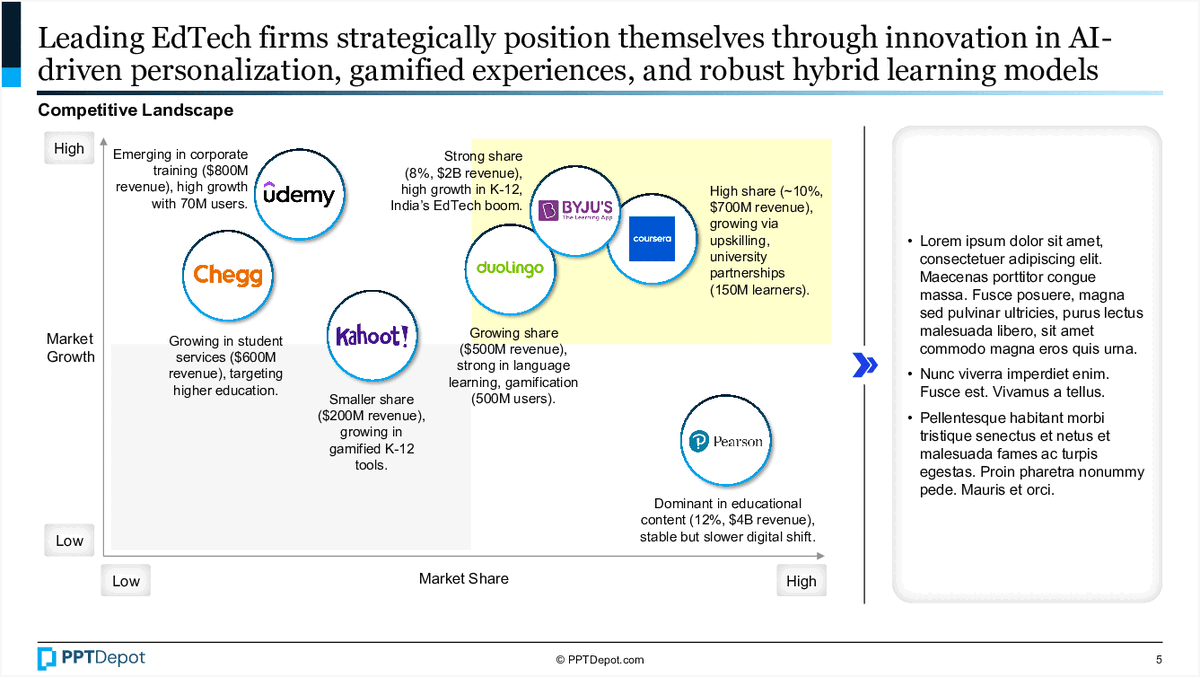
EdTech Firms Market Positioning
This slide illustrates the competitive landscape of leading EdTech companies, mapping their market share against growth potential. It visually categorizes firms based on their revenue, growth trajectory, and market share, providing a strategic snapshot of industry positioning for investors, strategists, and corporate development teams.
Smart Factory Adoption Landscape
This slide visualizes the competitive positioning of key manufacturing companies based on their market share and growth in smart factory adoption, specifically in automation and clean tech. It categorizes players into quadrants, highlighting leaders with strong share and high growth, and provides contextual insights on their strategic focus areas. The layout supports quick assessment of industry dynamics and competitive strengths.
Explore Slides by Tags
View Full Commercial Real Estate (CRE) PPT
Download our FREE collection of over 50+ high-impact, fully editable PowerPoint templates. These professional templates cover a comprehensive range of strategic analysis frameworks—including Strategy Formulation, Innovation, Digital Transformation, Change Management, and many others—ideal for Management Consultants, Investment Bankers, Strategy Professionals, and Business Executives.
Trusted by Leading Global Organizations
Our templates are trusted by thousands of organizations worldwide, including leading brands such as those listed below.
Related Templates from PPT Depot

Leverage our domain and design expertise. Become a subscriber today:
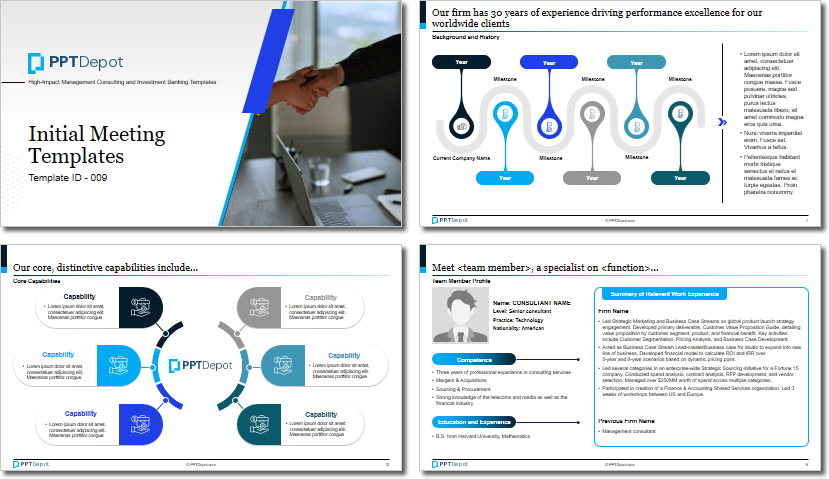
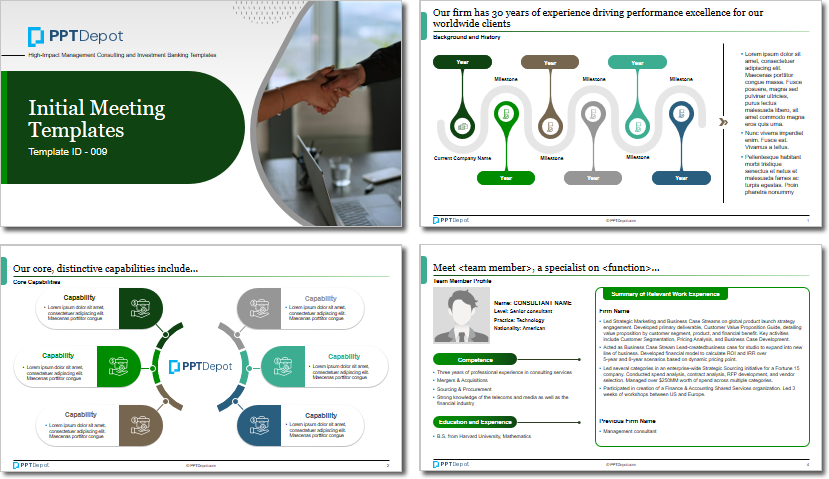
Each presentation is available in 3 color schemes. Download the version that most fits your firm's branding and customize it further once you download the PPTX file.


PPT Depot is your subscription to high-impact management consulting and investment banking templates—crafted from real-world deliverables by ex-MBB consultants and designed by former McKinsey Visual Graphics (VGI) presentation specialists. Compare plans here to determine what's the best fit for your firm.
With 15 years of experience, the team behind PPT Depot has empowered over 500+ clients across over 30+ countries. We currently produce 200,000 slides annually.
PPT Depot releases new templates each week. We have management topic-focused templates (e.g. market analysis, strategic planning, digital transformation, and more), alongside industry-specific collections. Peruse our full inventory here.
Save time and effort—elevate your presentations with proven domain and design expertise.
Got a question? Email us at [email protected].
Related Consulting Presentations
These presentations below are available for individual purchase from Flevy , the marketplace for business best practices.

Slide Customization & Production
We provide tailored slide customization and production services:
- Conversion of scanned notes into PowerPoint slides
- Development of PowerPoint master template
- Creation of data-driven PowerPoint charts from hand-drawn graphs
- Conversion of Excel charts to PowerPoint charts
- Conversion of other file formats (e.g. PDF, TIF, Word Doc) to PowerPoint slides
- Conversion of PowerPoint slides from one master template to another
- Visual enhancement of existing PowerPoint presentations to increase the professional look of the presentation
