Why This Slide Is Useful
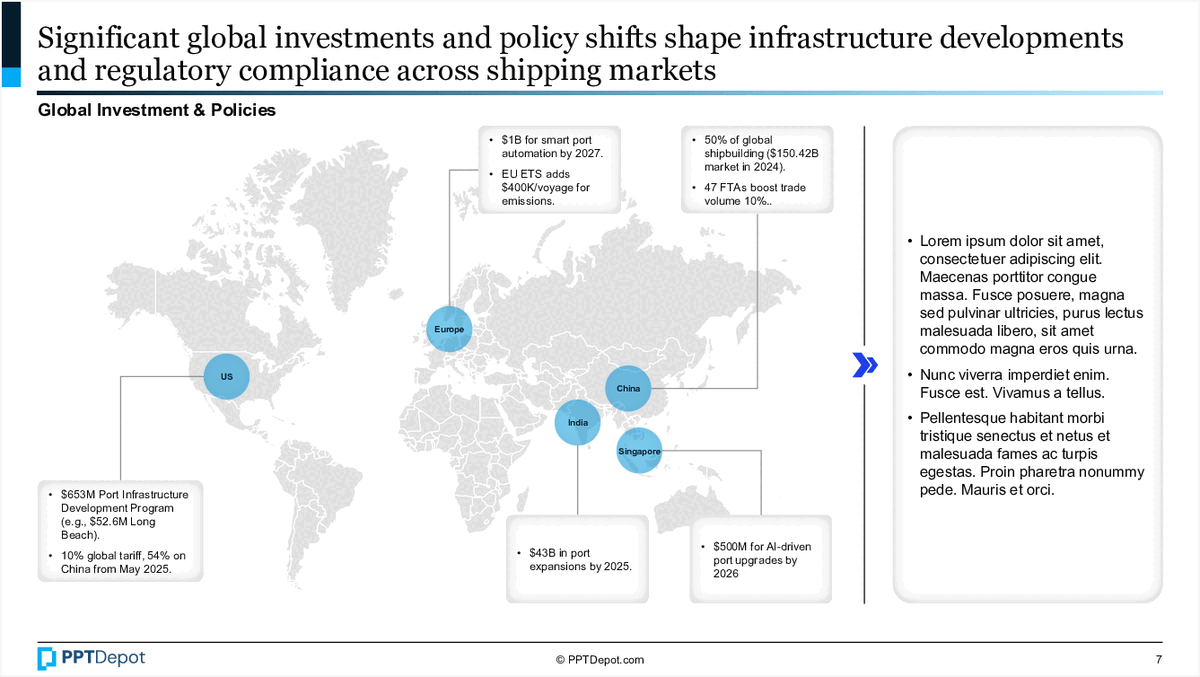
This slide is valuable for senior executives and strategic planners analyzing the shipping industry’s evolving landscape. It consolidates critical investment data and policy changes that could affect supply chain strategies, port infrastructure, and automation investments. For C-level leaders, understanding these regional shifts helps inform decisions on capital allocation and risk management in a complex global environment.
For management consultants, this slide offers a quick reference to macro trends shaping shipping markets. It enables targeted client advisory on infrastructure priorities, regulatory impacts, and emerging opportunities. The geographic focus combined with specific investment figures supports scenario planning and strategic positioning.
Investment bankers and PE professionals benefit from this overview by identifying regions with high growth potential or policy-driven incentives. The data points on port expansions and automation funding serve as signals for potential deal flow or portfolio adjustments. It also assists in assessing geopolitical risks and regulatory environments that influence valuation.
Operational leaders in shipping and logistics can leverage this slide to align infrastructure projects with regional policy shifts. The annotations about automation and port upgrades guide prioritization of capital projects. It also helps in communicating market trends to stakeholders, ensuring strategic initiatives are grounded in current investment patterns.
How This Slide Is Used
This slide is typically used in strategic planning sessions, market analysis reports, or investment decision frameworks. It provides a geographic and policy-oriented view that supports scenario analysis and risk assessment. Senior executives and portfolio managers use it to identify regions where policy changes may accelerate or hinder growth.
In consulting engagements, this slide often forms part of a broader market entry or expansion strategy. It helps clients understand where government incentives or infrastructure investments are creating opportunities or risks. The visual map simplifies complex data, making it easier to communicate regional priorities to diverse audiences.
For investors, especially those involved in infrastructure or shipping assets, this slide informs due diligence and valuation models. It highlights policy commitments and investment levels that could influence future cash flows and asset values. The annotations serve as quick reference points for assessing regional momentum.
Operational teams use this slide to align project timelines with policy milestones or investment waves. For example, port expansion figures can guide planning for capacity upgrades or automation initiatives. It also supports stakeholder communication by providing a clear, visual summary of global investment trends.
Related PPT Slides
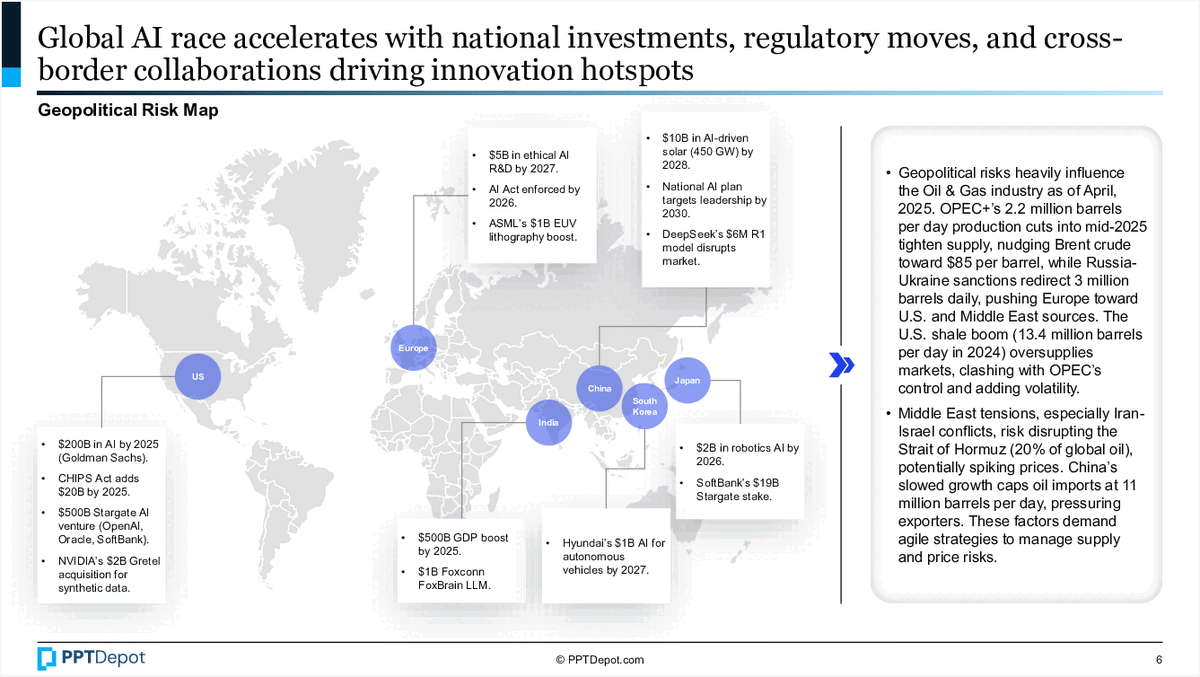
Geopolitical Risks in AI and Oil
This slide maps the geopolitical risks impacting AI development and oil markets, highlighting key country-specific and industry-related factors. It emphasizes how regulatory moves, investments, and cross-border collaborations influence innovation hotspots and supply chain stability, offering a strategic view for executives managing global risks.
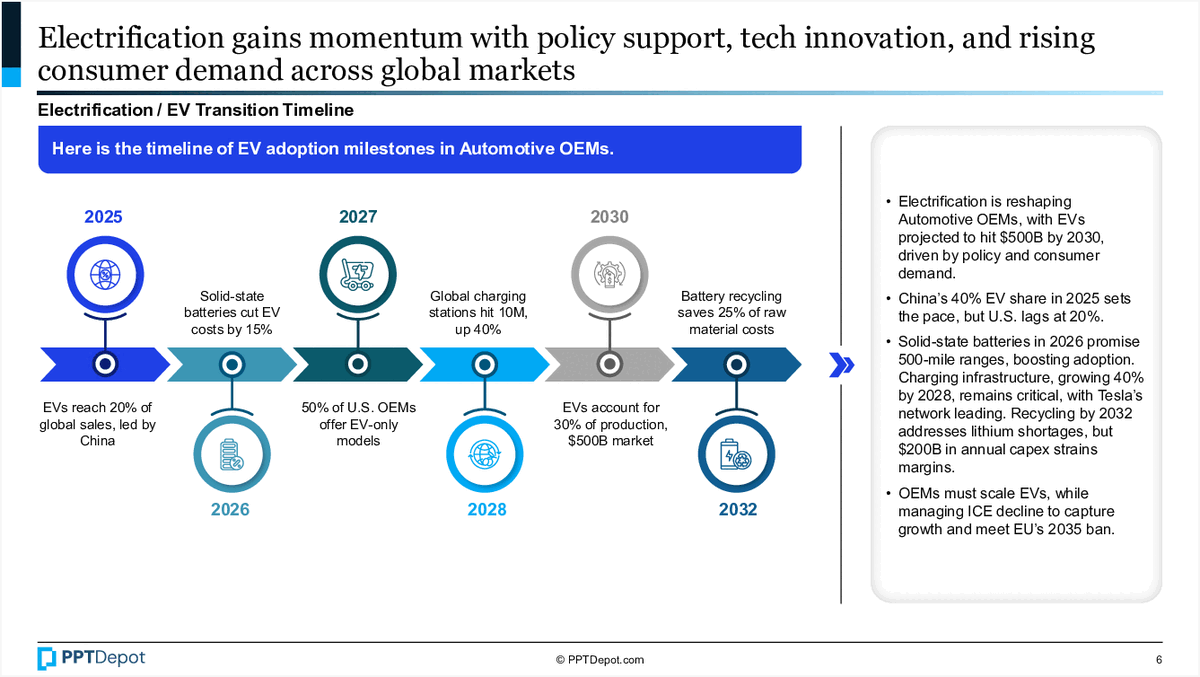
EV Adoption Timeline in Automotive OEMs
This slide illustrates the key milestones in the adoption of electric vehicles (EVs) within automotive original equipment manufacturers (OEMs). It highlights the projected policy-driven and technological advancements from 2025 to 2032, emphasizing the impact of regulations, market share, and infrastructure development on EV adoption rates globally and in the U.S.
Infrastructure Maturity and Action Plan
This slide tracks the progression of infrastructure maturity across key indices—DMI, TMI, AMI, and OMI—over a 12-month period. It includes a detailed action plan with target closure dates and parameters, supported by attachments for each index. The layout facilitates monitoring and planning for technology and automation improvements within a structured timeframe.
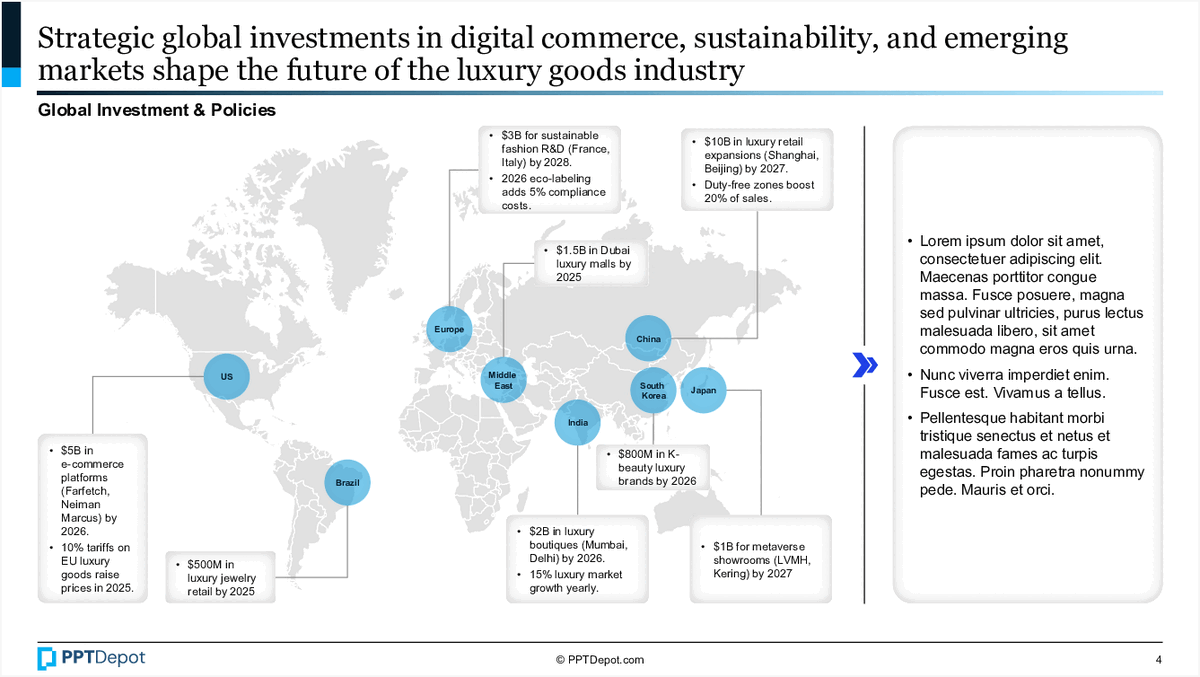
Luxury Goods Industry Investment Trends
This slide illustrates key global investment patterns in the luxury goods sector, highlighting major markets and projected financial flows. It combines a world map with specific investment figures and future forecasts, providing a visual summary of where capital is flowing and expected growth areas within the industry.
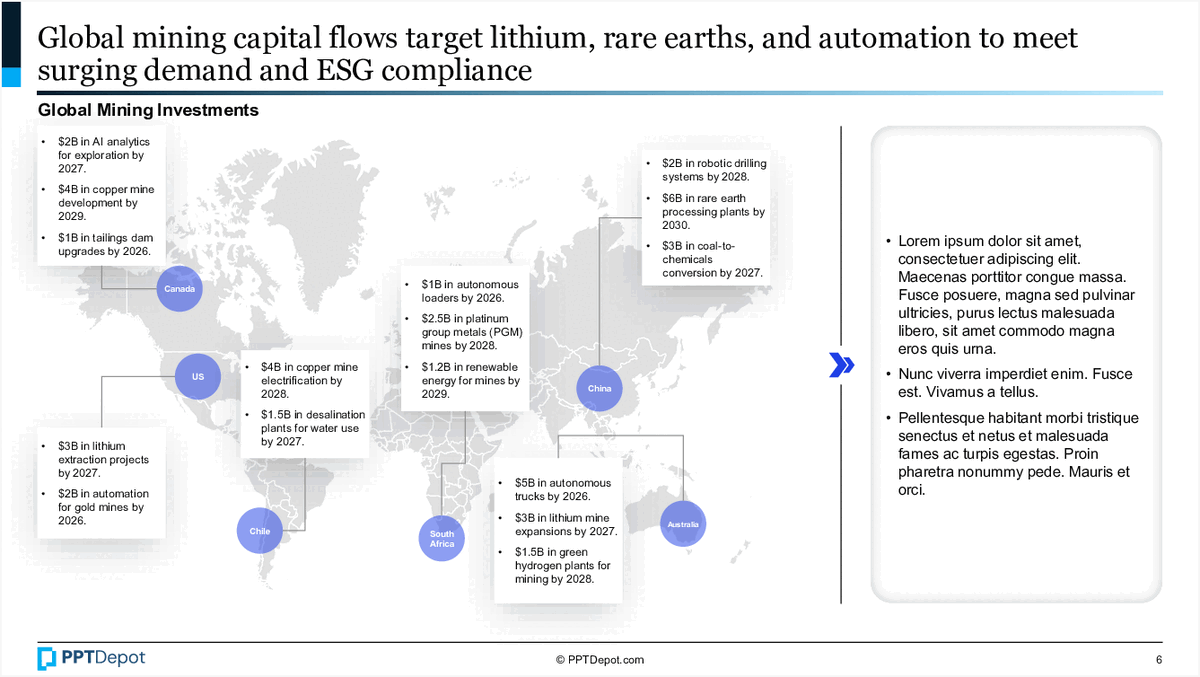
This slide illustrates the distribution of global mining investments, highlighting key regions and specific project funding details. It emphasizes the focus on lithium, rare earths, and automation, aligning with ESG compliance and future demand. The visual map and accompanying notes provide a quick geographic and financial snapshot for strategic decision-making.
Global Solar Investment Trends
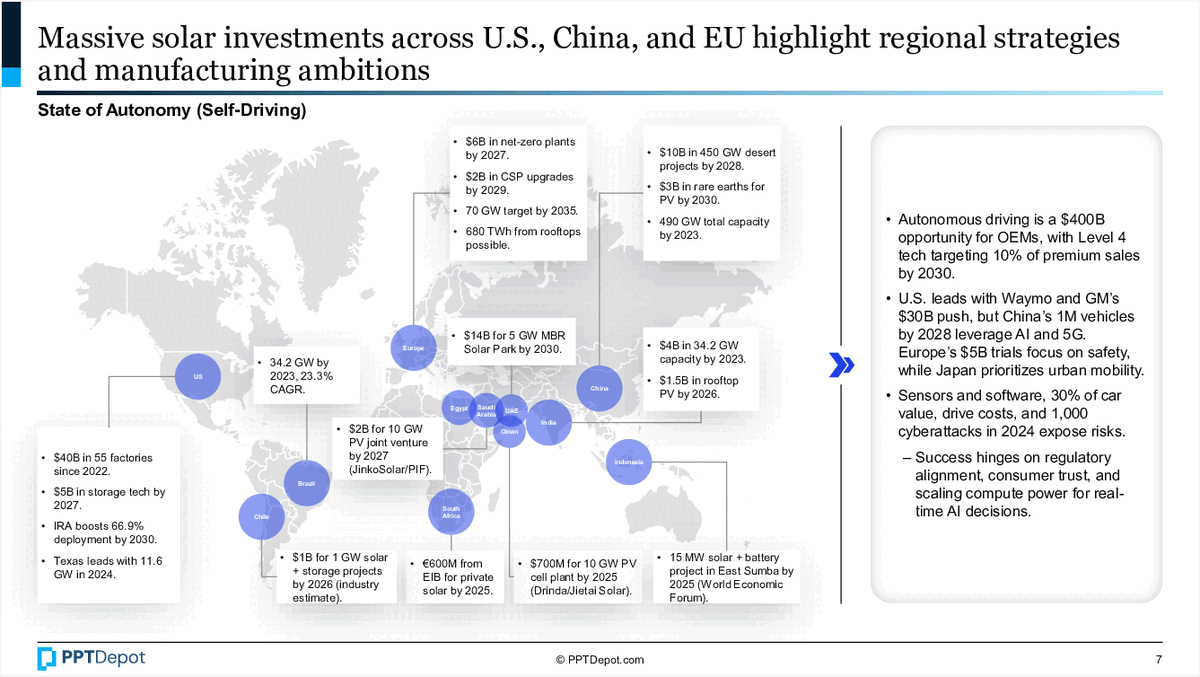
This slide illustrates the scale and regional focus of solar investments across key markets including the U.S., China, and Europe. It highlights specific project sizes, capacity targets, and strategic ambitions, emphasizing the accelerating momentum in solar energy deployment and the economic opportunities associated with autonomous driving and renewable infrastructure.
Explore Slides by Tags
Download our FREE collection of over 50+ high-impact, fully editable PowerPoint templates. These professional templates cover a comprehensive range of strategic analysis frameworks—including Strategy Formulation, Innovation, Digital Transformation, Change Management, and many others—ideal for Management Consultants, Investment Bankers, Strategy Professionals, and Business Executives.
Trusted by Leading Global Organizations
Our templates are trusted by thousands of organizations worldwide, including leading brands such as those listed below.
Related Templates from PPT Depot

Leverage our domain and design expertise. Become a subscriber today:
Each presentation is available in 3 color schemes. Download the version that most fits your firm's branding and customize it further once you download the PPTX file.


PPT Depot is your subscription to high-impact management consulting and investment banking templates—crafted from real-world deliverables by ex-MBB consultants and designed by former McKinsey Visual Graphics (VGI) presentation specialists. Compare plans here to determine what's the best fit for your firm.
With 15 years of experience, the team behind PPT Depot has empowered over 500+ clients across over 30+ countries. We currently produce 200,000 slides annually.
PPT Depot releases new templates each week. We have management topic-focused templates (e.g. market analysis, strategic planning, digital transformation, and more), alongside industry-specific collections. Peruse our full inventory here.
Save time and effort—elevate your presentations with proven domain and design expertise.
Got a question? Email us at [email protected].
Related Consulting Presentations
These presentations below are available for individual purchase from Flevy , the marketplace for business best practices.

Slide Customization & Production
We provide tailored slide customization and production services:
- Conversion of scanned notes into PowerPoint slides
- Development of PowerPoint master template
- Creation of data-driven PowerPoint charts from hand-drawn graphs
- Conversion of Excel charts to PowerPoint charts
- Conversion of other file formats (e.g. PDF, TIF, Word Doc) to PowerPoint slides
- Conversion of PowerPoint slides from one master template to another
- Visual enhancement of existing PowerPoint presentations to increase the professional look of the presentation
