Why This Slide Is Useful
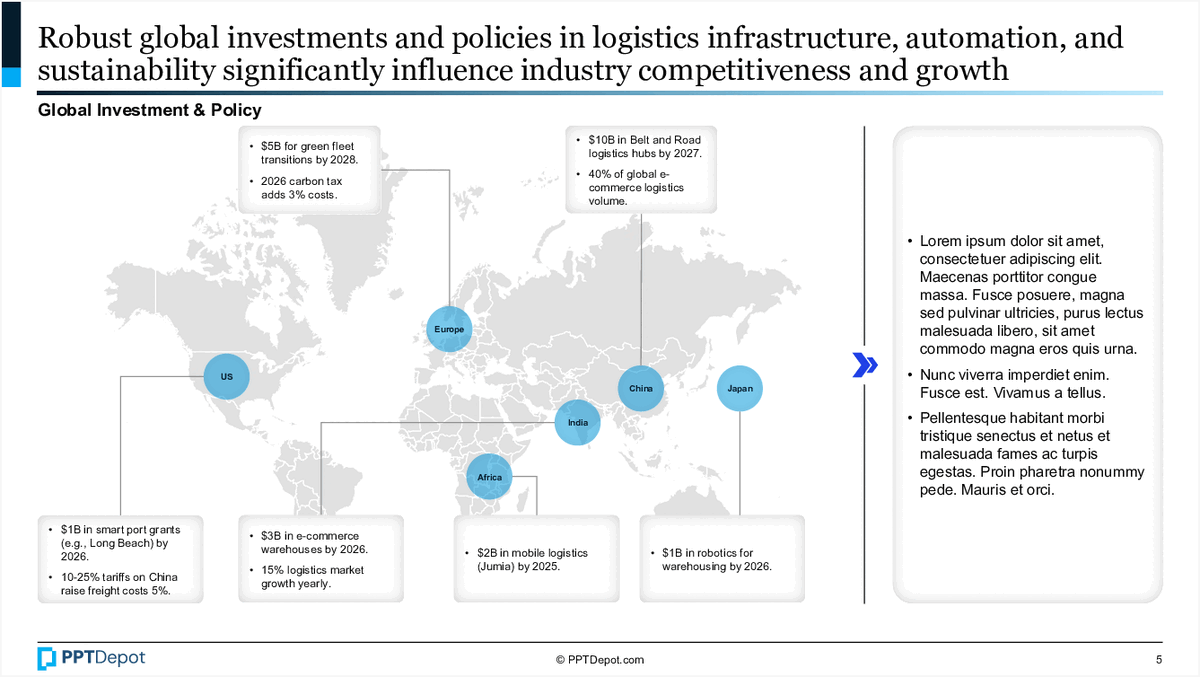
This slide is valuable for senior executives and consultants focused on global supply chains and infrastructure development. It offers a clear snapshot of where significant investments are directed, emphasizing regions like Europe, China, and the US, which are critical to understanding industry shifts. The inclusion of specific financial figures and policy milestones helps decision-makers assess market opportunities and risks in logistics and e-commerce sectors.
For investment bankers and PE firms, this slide provides a high-level view of where capital flows are concentrated, guiding due diligence and deal prioritization. It also signals emerging policy-driven growth areas, which can influence valuation and strategic positioning. The data points serve as benchmarks for evaluating industry momentum and identifying potential investment targets.
Management consultants can leverage this slide to frame client discussions around infrastructure readiness and policy impacts. It underscores the importance of aligning supply chain strategies with regional investment trends and regulatory environments. The visual map combined with key figures simplifies complex macroeconomic dynamics into actionable insights for strategic planning.
Finally, the slide supports stakeholder communication by summarizing global investment priorities in logistics. It helps executives articulate how policy and infrastructure developments are shaping industry competitiveness, enabling more informed discussions with investors, government agencies, and operational teams.
How This Slide Is Used
This slide is typically used in strategic planning, market entry analysis, or investment evaluation sessions. It serves as a foundation for discussions on regional growth opportunities and policy impacts on logistics investments. For example, a supply chain strategist might use it to identify emerging markets with significant government backing and infrastructure projects.
In consulting projects, this slide is often customized to include specific client regions or sectors. For instance, a client expanding e-commerce operations may focus on the logistics growth figures for China and Europe, aligning their expansion plans accordingly. The visual map helps visualize geographic priorities and investment hotspots.
Investment teams use this slide during due diligence to understand macro trends influencing logistics assets. It supports scenario planning around policy changes, such as new tariffs or sustainability mandates, which could alter investment returns. The detailed figures and policy notes provide context for risk assessment and opportunity sizing.
In stakeholder presentations, this slide simplifies complex macroeconomic data into a digestible format. It can be used to justify strategic shifts, such as increasing capital allocation to certain regions or sectors. The combination of quantitative data and policy context makes it a versatile tool for aligning internal teams and external partners around shared growth drivers.
Related PPT Slides
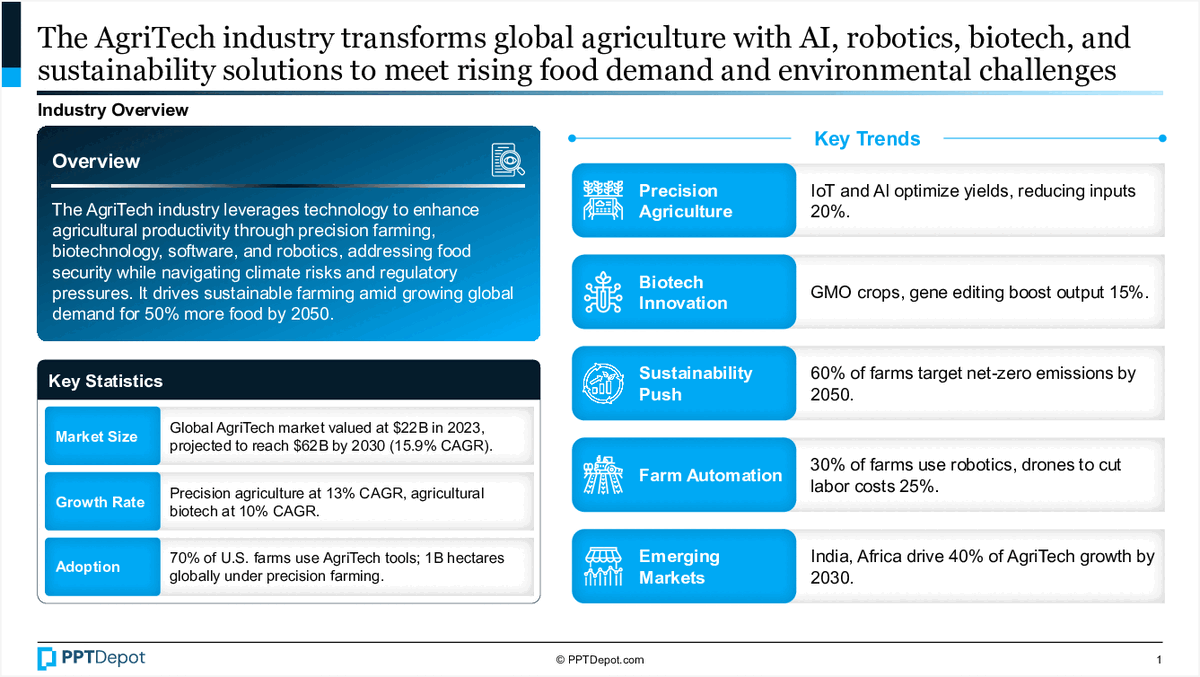
AgriTech Industry Overview and Key Trends
This slide outlines the transformation of the global agriculture sector driven by AI, robotics, biotech, and sustainability solutions. It highlights industry leverage points, key statistics, and emerging trends aimed at meeting rising food demand and environmental challenges by 2050.
AI and Cloud Computing Market Landscape
This slide maps the competitive landscape of AI and cloud computing technology providers, highlighting their market share, growth potential, and strategic positioning. It visualizes key players such as Amazon, Google, Microsoft, NVIDIA, AMD, and emerging Chinese firms, emphasizing their relative dominance and innovation trajectories. The chart offers a quick snapshot of industry dynamics for strategic decision-making and investment considerations.
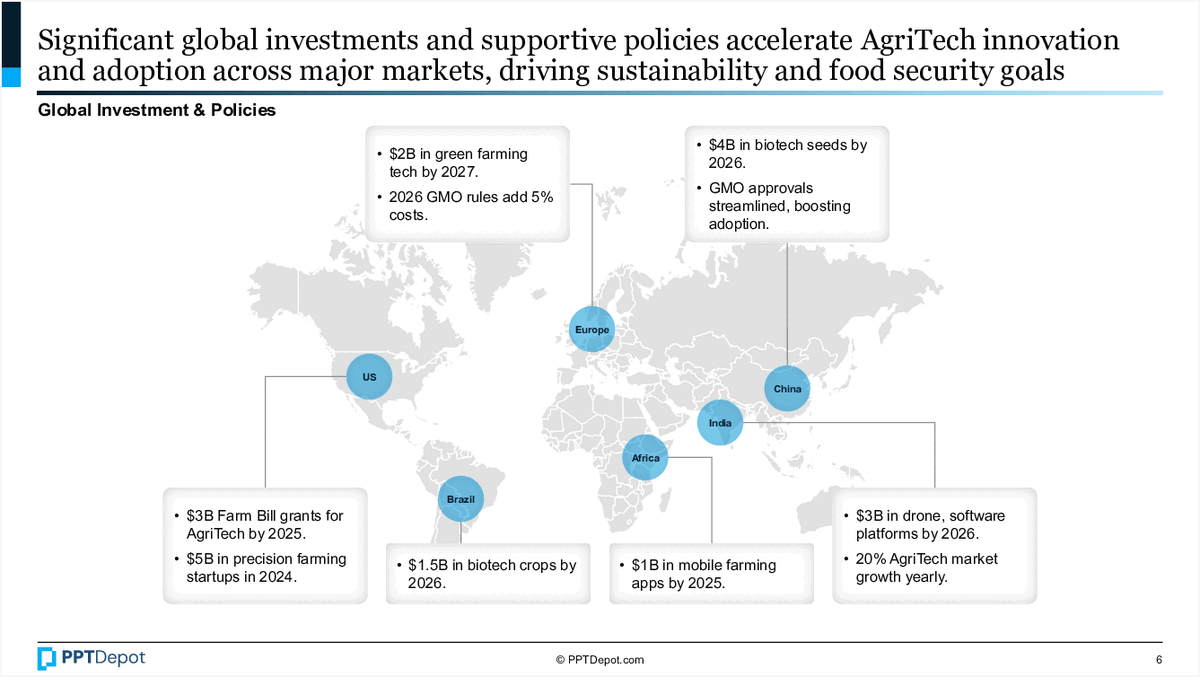
Global Investment Trends in AgriTech
This slide highlights key investment figures and policy developments shaping the AgriTech sector across major markets. It emphasizes the scale of funding, regulatory changes, and technological advancements driving sustainable agriculture and food security initiatives worldwide. The visual map connects these trends to specific regions, providing a comprehensive snapshot for strategic decision-making.
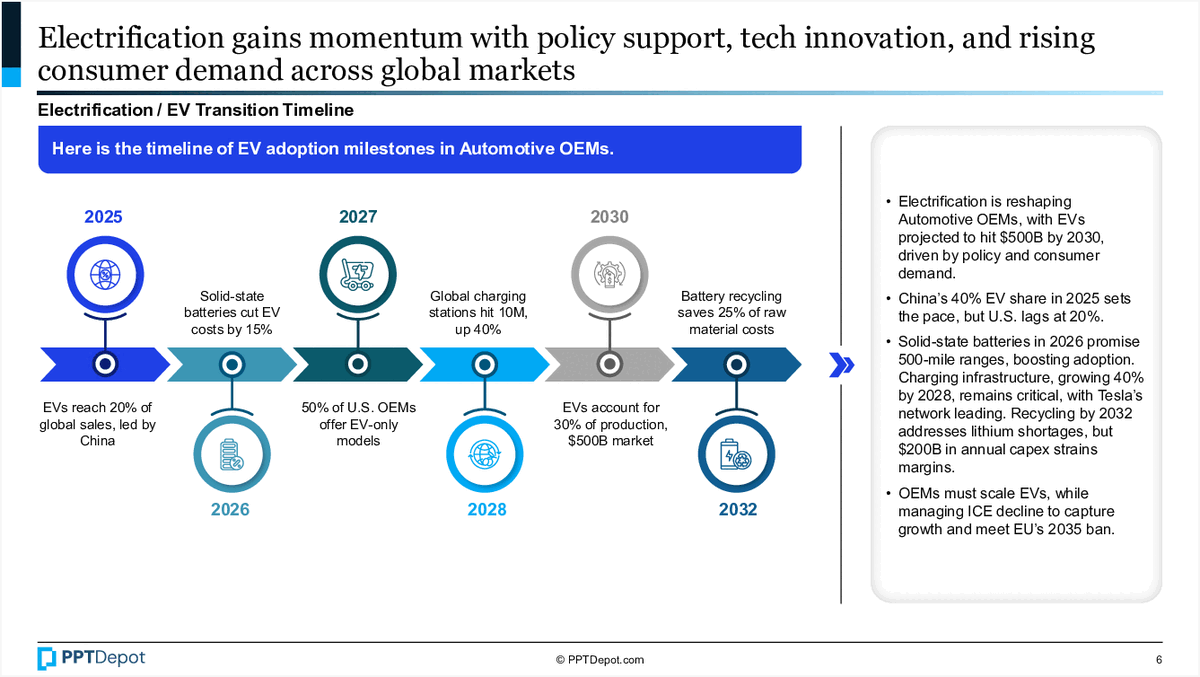
EV Adoption Timeline in Automotive OEMs
This slide illustrates the key milestones in the adoption of electric vehicles (EVs) within automotive original equipment manufacturers (OEMs). It highlights the projected policy-driven and technological advancements from 2025 to 2032, emphasizing the impact of regulations, market share, and infrastructure development on EV adoption rates globally and in the U.S.
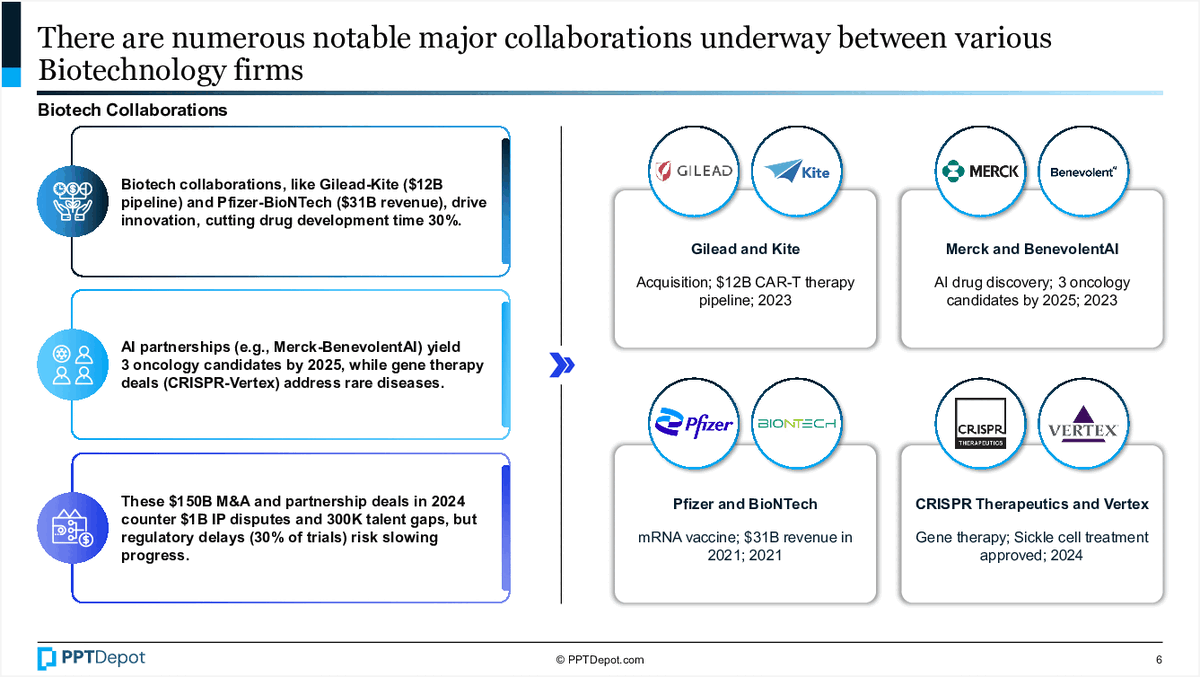
Biotech Industry Collaborations
This slide highlights key collaborations among major biotech firms, emphasizing recent acquisitions, joint ventures, and strategic partnerships. It provides a snapshot of the scale, focus areas, and timelines of these alliances, illustrating the dynamic nature of innovation-driven growth in the biotech sector. The visual layout combines icons, brief descriptions, and timelines to facilitate quick comprehension for executive decision-makers.
Market Share and Competitor Trends
This slide compares the market value shares of nine competitors between 2021 and 2025, illustrating how their positions are projected to shift over time. It combines a visual breakdown of individual share changes with a summarized table of competitors' compound annual growth rates (CAGR), providing a comprehensive view of market dynamics for strategic assessment.
Explore Slides by Tags
Download our FREE collection of over 50+ high-impact, fully editable PowerPoint templates. These professional templates cover a comprehensive range of strategic analysis frameworks—including Strategy Formulation, Innovation, Digital Transformation, Change Management, and many others—ideal for Management Consultants, Investment Bankers, Strategy Professionals, and Business Executives.
Trusted by Leading Global Organizations
Our templates are trusted by thousands of organizations worldwide, including leading brands such as those listed below.
Related Templates from PPT Depot

Leverage our domain and design expertise. Become a subscriber today:
Each presentation is available in 3 color schemes. Download the version that most fits your firm's branding and customize it further once you download the PPTX file.


PPT Depot is your subscription to high-impact management consulting and investment banking templates—crafted from real-world deliverables by ex-MBB consultants and designed by former McKinsey Visual Graphics (VGI) presentation specialists. Compare plans here to determine what's the best fit for your firm.
With 15 years of experience, the team behind PPT Depot has empowered over 500+ clients across over 30+ countries. We currently produce 200,000 slides annually.
PPT Depot releases new templates each week. We have management topic-focused templates (e.g. market analysis, strategic planning, digital transformation, and more), alongside industry-specific collections. Peruse our full inventory here.
Save time and effort—elevate your presentations with proven domain and design expertise.
Got a question? Email us at [email protected].
Related Consulting Presentations
These presentations below are available for individual purchase from Flevy , the marketplace for business best practices.

Slide Customization & Production
We provide tailored slide customization and production services:
- Conversion of scanned notes into PowerPoint slides
- Development of PowerPoint master template
- Creation of data-driven PowerPoint charts from hand-drawn graphs
- Conversion of Excel charts to PowerPoint charts
- Conversion of other file formats (e.g. PDF, TIF, Word Doc) to PowerPoint slides
- Conversion of PowerPoint slides from one master template to another
- Visual enhancement of existing PowerPoint presentations to increase the professional look of the presentation
