Why This Slide Is Useful
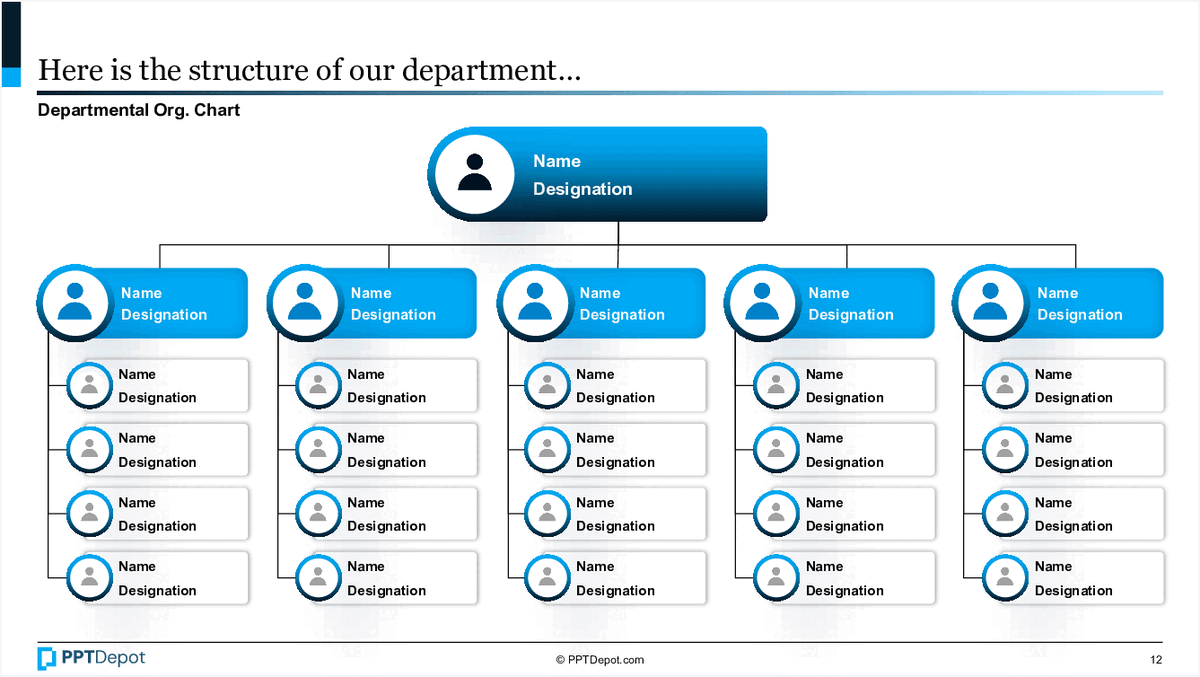
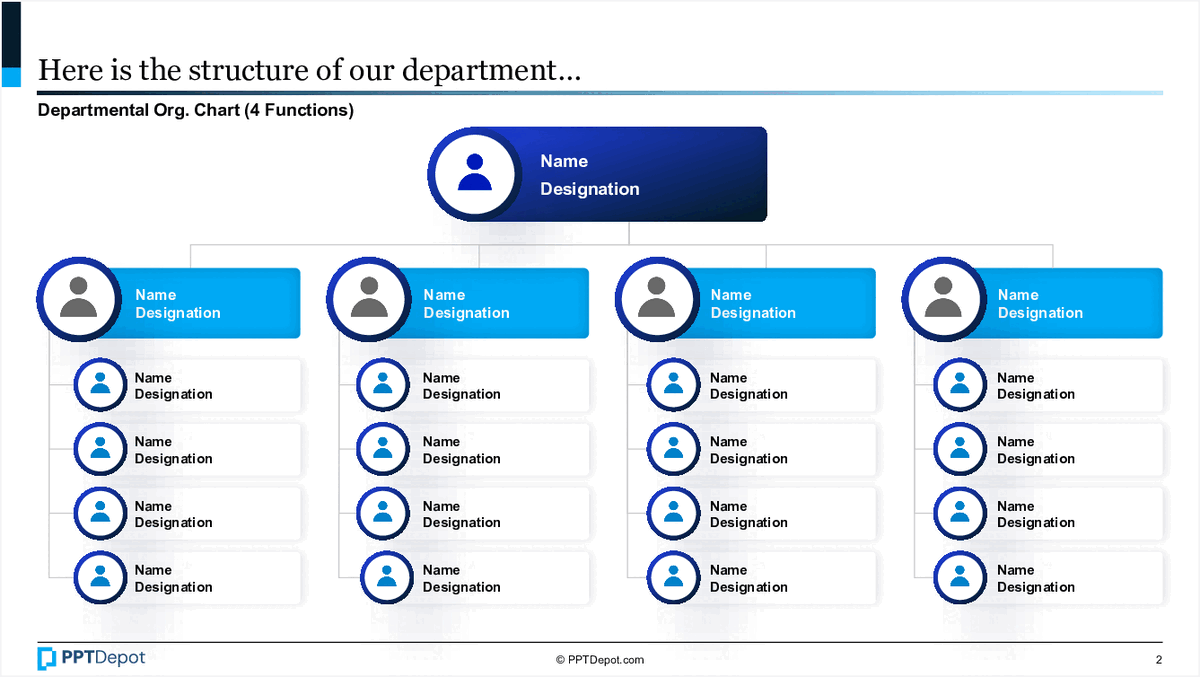
This slide is useful because it offers a straightforward visualization of departmental structure, enabling leadership to assess resource allocation and reporting relationships at a glance. It helps identify potential overlaps or gaps in team coverage, supporting decisions on restructuring or resource rebalancing.
For C-level executives and strategy consultants, this diagram facilitates understanding of how functions are organized within the department. It supports discussions on operational efficiency, accountability, and decision-making authority, especially during organizational redesigns or process improvements.
The visual format makes it easy to communicate complex organizational details during executive briefings or stakeholder presentations. It also serves as a reference point for onboarding new leaders or aligning teams around a common structure.
This slide can be adapted for various purposes, such as planning headcount, defining roles, or preparing for integration activities in mergers and acquisitions. Its simplicity ensures it remains a versatile tool for strategic discussions and operational reviews.
How This Slide Is Used
This slide is typically used in organizational design workshops, team alignment sessions, or during due diligence processes. Leaders rely on it to map out current structures or propose future configurations, ensuring clarity on roles and reporting lines.
In consulting projects, this diagram often forms the basis for analyzing organizational effectiveness. Consultants may customize it by adding color codes or annotations to highlight functional overlaps, redundancies, or areas for streamlining.
During change management initiatives, this slide helps communicate structural shifts to teams. It provides a visual reference to explain new reporting relationships or team consolidations, reducing ambiguity and resistance.
In merger or acquisition scenarios, this slide supports integration planning by illustrating how departments will be combined or restructured. It enables stakeholders to visualize the target organization and plan transition steps accordingly.
Related PPT Slides
Departmental Organizational Chart
This slide illustrates the hierarchical structure of a department, highlighting key roles and reporting lines. It uses a visual format with icons and placeholders for names and designations, enabling quick understanding of team composition and leadership distribution at a glance.
Departmental Organizational Chart
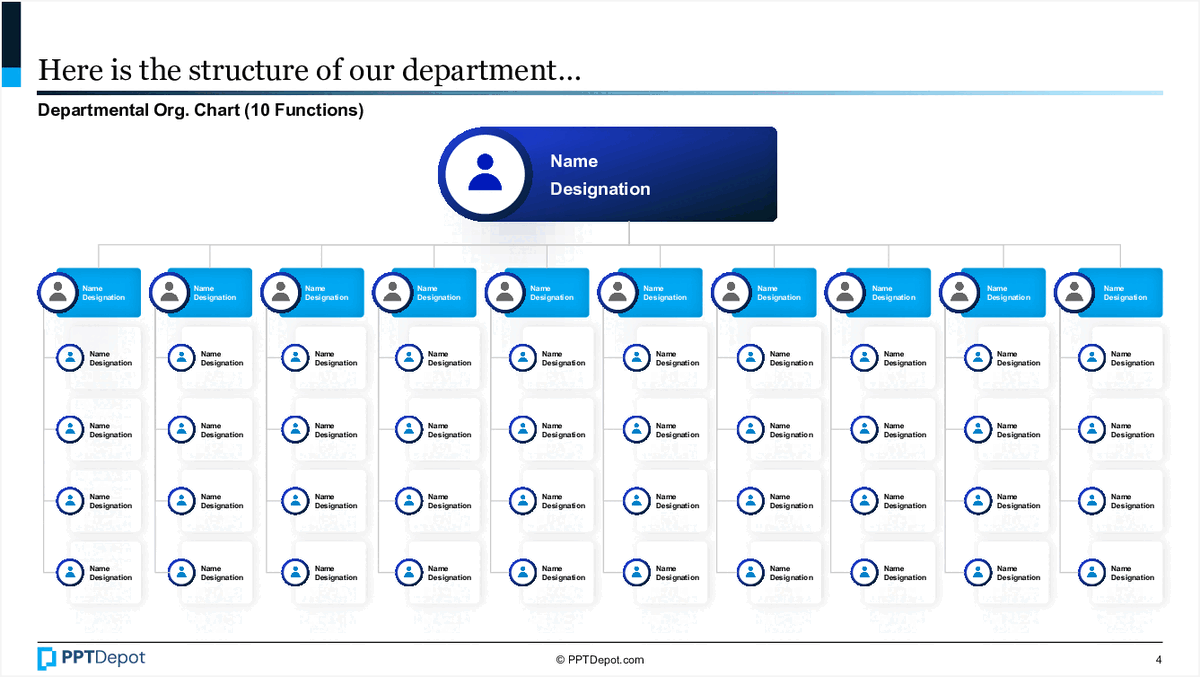
This slide displays a hierarchical structure of a department, illustrating the reporting relationships among ten functions. It uses icons and color coding to differentiate roles and positions, providing a clear visual of the department’s composition and reporting lines for strategic or operational review.
Departmental Organizational Chart
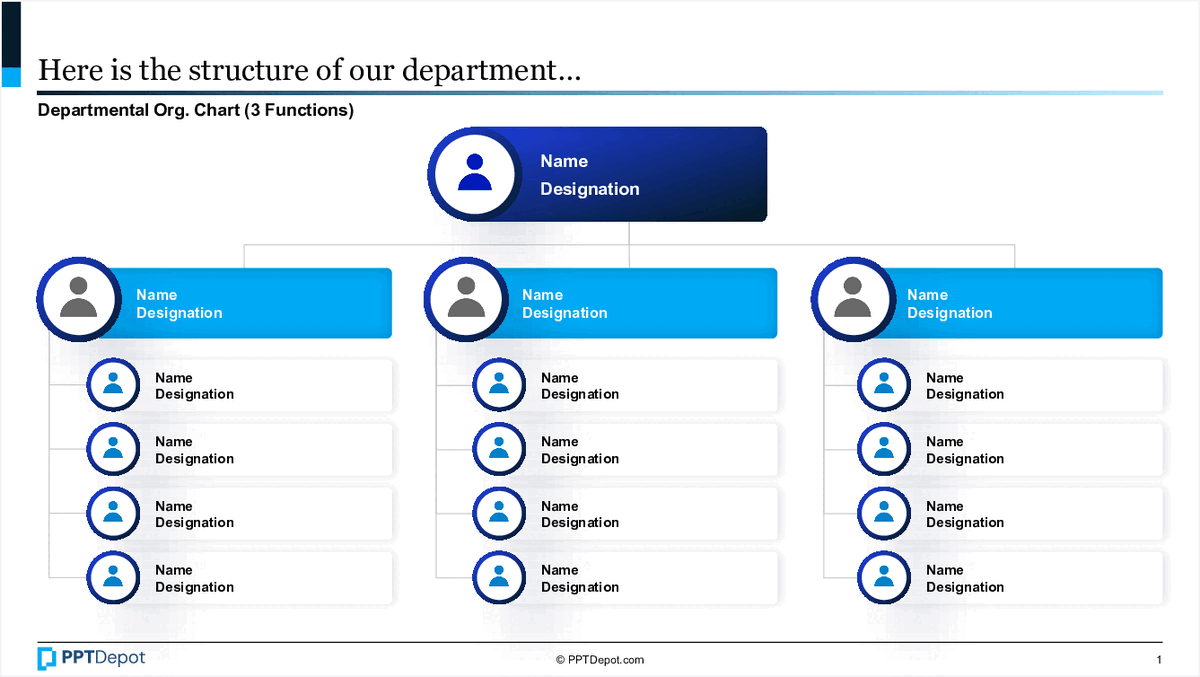
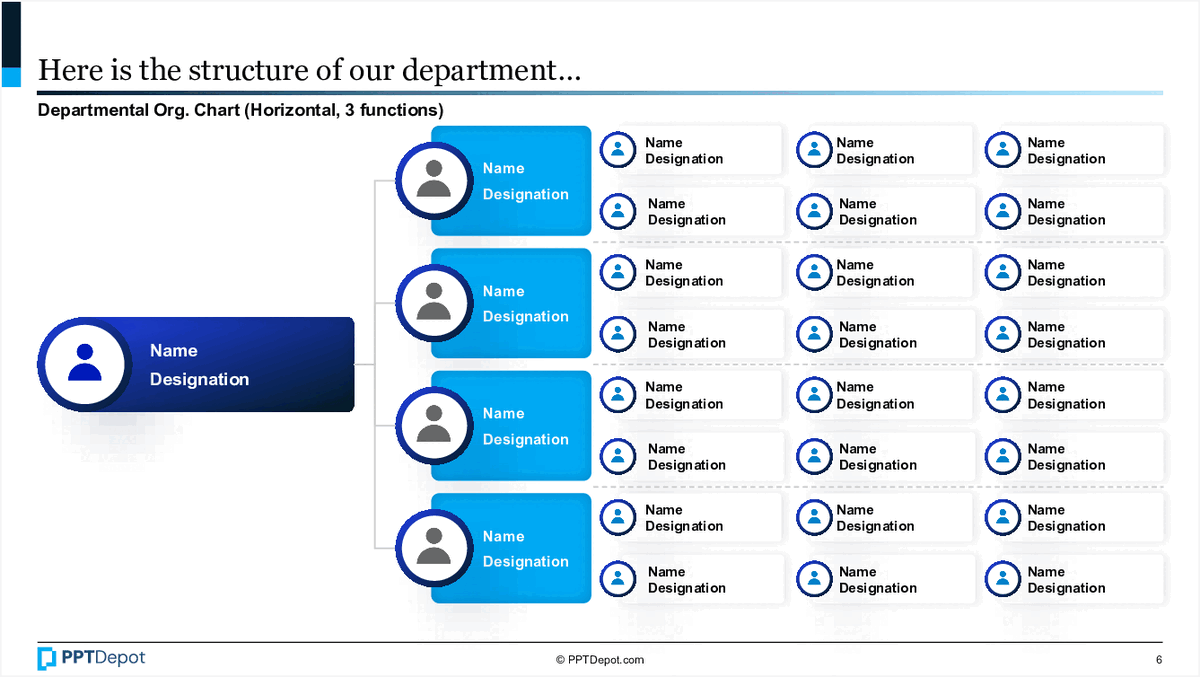
This slide illustrates the structure of a department through a visual hierarchy, displaying 3 main functions with their respective team members. It emphasizes clarity in reporting lines and role allocation, enabling quick understanding of departmental composition for strategic or operational planning.
Departmental Organizational Structure
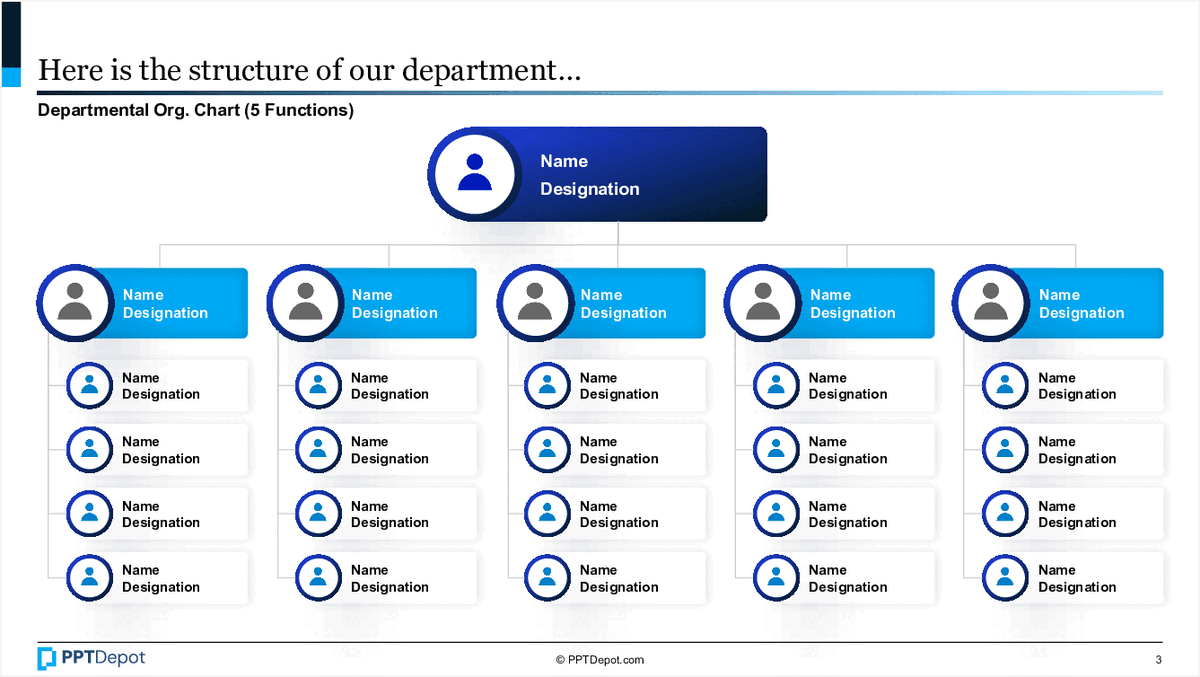
This slide depicts a hierarchical chart illustrating the structure of a department with 5 key functions. It emphasizes individual roles, including names and designations, organized under a central leadership figure. The visual layout supports clarity in understanding reporting lines and team composition at a glance.
Departmental Organizational Chart
This slide illustrates a departmental structure with a focus on 3 primary functions. It displays a hierarchical layout, starting with a key leader and branching out to multiple team members, each with designated roles. The design emphasizes clarity in reporting lines and team composition for strategic or operational planning discussions.
Organizational Hierarchy Structure
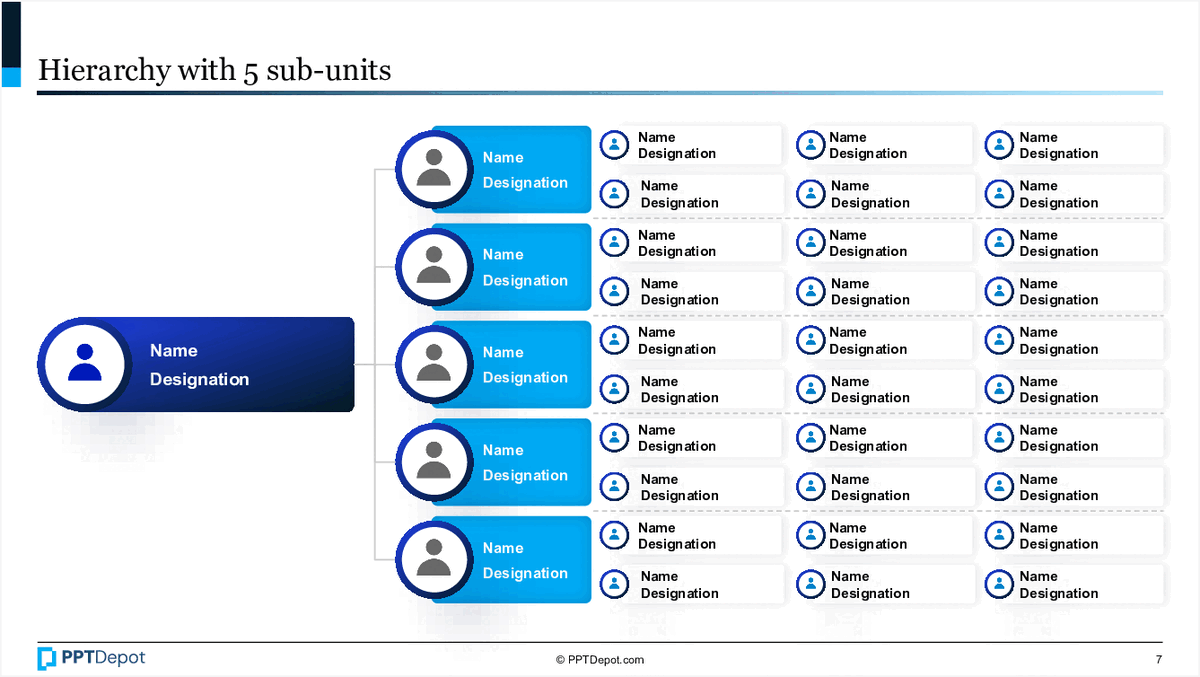
This slide illustrates a hierarchical organizational structure with 5 sub-units branching from a central leadership role. It provides a clear visual of reporting lines and role designations, emphasizing the chain of command within a company or division. The layout is designed for quick comprehension by senior management and organizational design teams.
Explore Slides by Tags
View Full Organizational Structure PPT
Download our FREE collection of over 50+ high-impact, fully editable PowerPoint templates. These professional templates cover a comprehensive range of strategic analysis frameworks—including Strategy Formulation, Innovation, Digital Transformation, Change Management, and many others—ideal for Management Consultants, Investment Bankers, Strategy Professionals, and Business Executives.
Trusted by Leading Global Organizations
Our templates are trusted by thousands of organizations worldwide, including leading brands such as those listed below.
Related Templates from PPT Depot

Leverage our domain and design expertise. Become a subscriber today:
Each presentation is available in 3 color schemes. Download the version that most fits your firm's branding and customize it further once you download the PPTX file.


PPT Depot is your subscription to high-impact management consulting and investment banking templates—crafted from real-world deliverables by ex-MBB consultants and designed by former McKinsey Visual Graphics (VGI) presentation specialists. Compare plans here to determine what's the best fit for your firm.
With 15 years of experience, the team behind PPT Depot has empowered over 500+ clients across over 30+ countries. We currently produce 200,000 slides annually.
PPT Depot releases new templates each week. We have management topic-focused templates (e.g. market analysis, strategic planning, digital transformation, and more), alongside industry-specific collections. Peruse our full inventory here.
Save time and effort—elevate your presentations with proven domain and design expertise.
Got a question? Email us at [email protected].
Related Consulting Presentations
These presentations below are available for individual purchase from Flevy , the marketplace for business best practices.

Slide Customization & Production
We provide tailored slide customization and production services:
- Conversion of scanned notes into PowerPoint slides
- Development of PowerPoint master template
- Creation of data-driven PowerPoint charts from hand-drawn graphs
- Conversion of Excel charts to PowerPoint charts
- Conversion of other file formats (e.g. PDF, TIF, Word Doc) to PowerPoint slides
- Conversion of PowerPoint slides from one master template to another
- Visual enhancement of existing PowerPoint presentations to increase the professional look of the presentation
