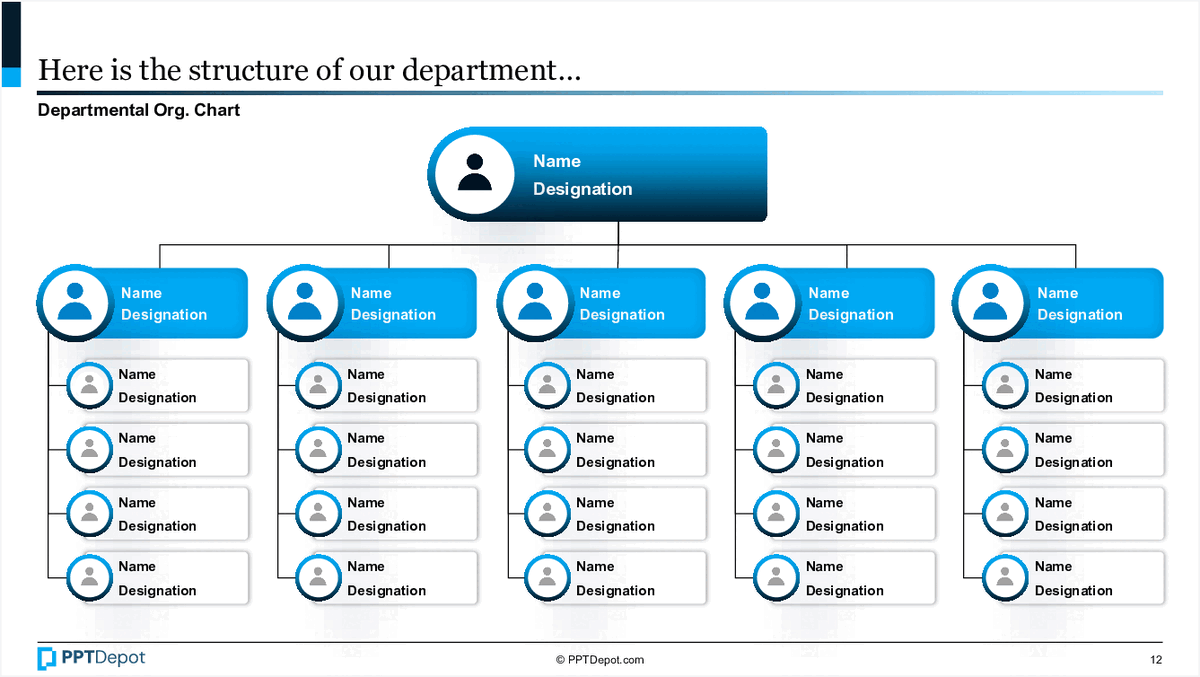
Departmental Organizational Chart

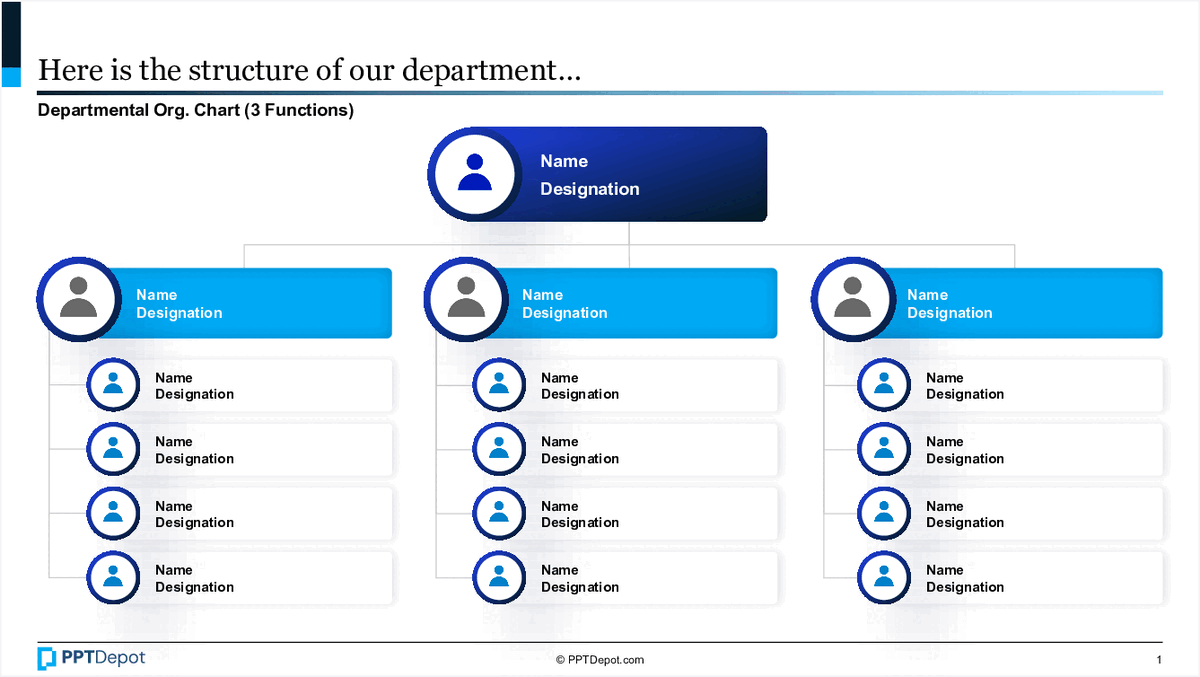
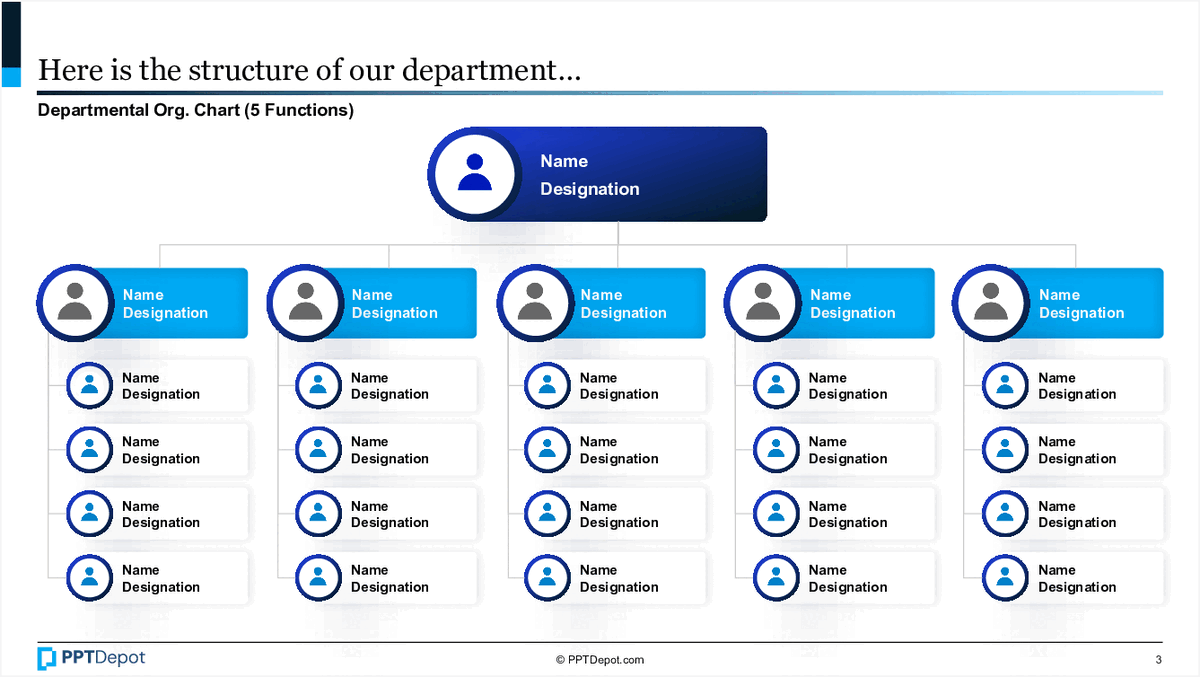
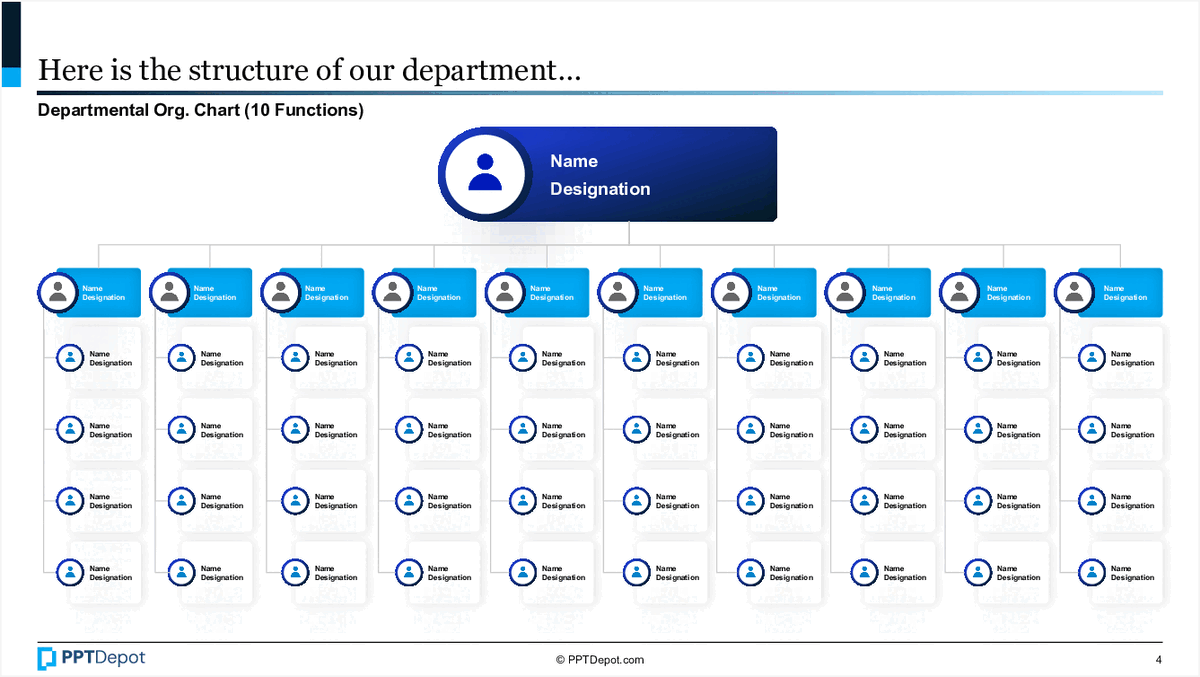
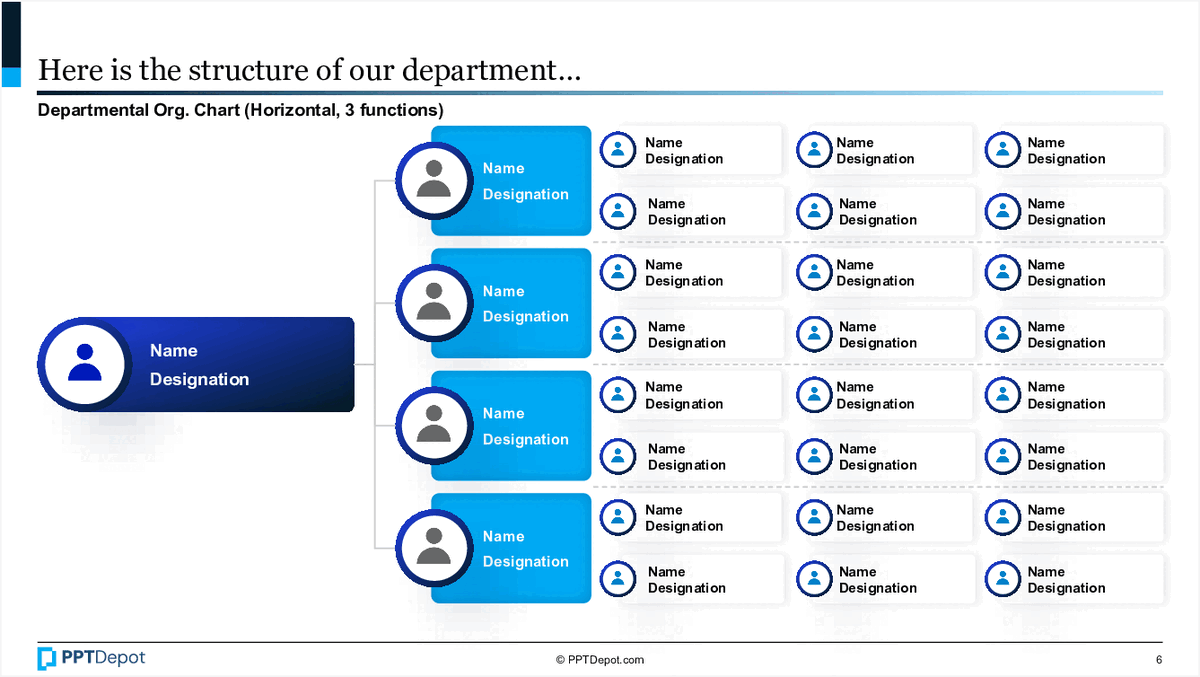
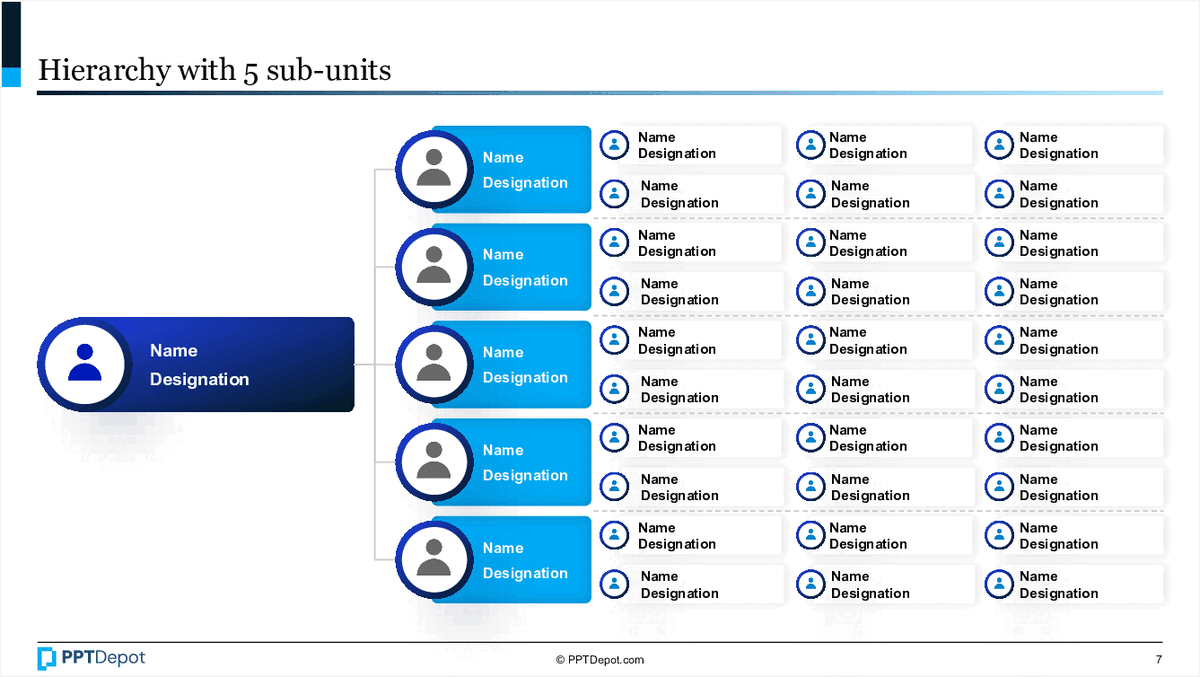
This slide illustrates the hierarchical structure of a department, highlighting key roles and reporting lines. It uses a visual format with icons and placeholders for names and designations, enabling quick understanding of team composition and leadership distribution at a glance.


Why This Slide Is Useful

This slide is valuable for management-level audiences such as strategists and senior consultants because it provides a clear snapshot of organizational design. It helps identify leadership layers, span of control, and potential gaps or overlaps within the department. Such clarity supports strategic decisions related to restructuring, resource allocation, or leadership development.

For executives and decision-makers, understanding the department’s structure aids in aligning operational priorities with organizational capacity. It facilitates discussions about accountability, delegation, and communication pathways, which are critical during transformation initiatives or when onboarding new leadership.

Management consultants use this slide as a diagnostic tool to assess organizational health. It serves as a baseline for recommending structural adjustments or leadership realignments. The visual format allows for easy customization and quick updates during client workshops or strategic planning sessions.

This slide also supports stakeholder communication by providing a straightforward depiction of team composition. It can be integrated into broader organizational or project dashboards, helping leadership and teams stay aligned on roles and reporting relationships during change efforts.

How This Slide Is Used

This slide is typically used in organizational design workshops, onboarding sessions, or strategic planning meetings. It helps leadership teams visualize current reporting lines and team configurations, which is essential when planning restructuring or capacity planning.

In consulting engagements, this chart is often customized to reflect different scenarios or future states. For example, a client might explore consolidating roles or creating new leadership positions, and this slide can be adjusted to illustrate those changes.

During transformation initiatives, the slide supports communication with both internal teams and external stakeholders. It clarifies who reports to whom, ensuring everyone understands the new or existing structure, which reduces confusion and resistance.

Additionally, this slide is used in talent reviews and succession planning. It highlights key roles and potential gaps, enabling leadership to prioritize development efforts or identify critical talent pools. It can also serve as a reference point for onboarding new managers or team members, providing context on reporting relationships and organizational hierarchy.

Related PPT Slides


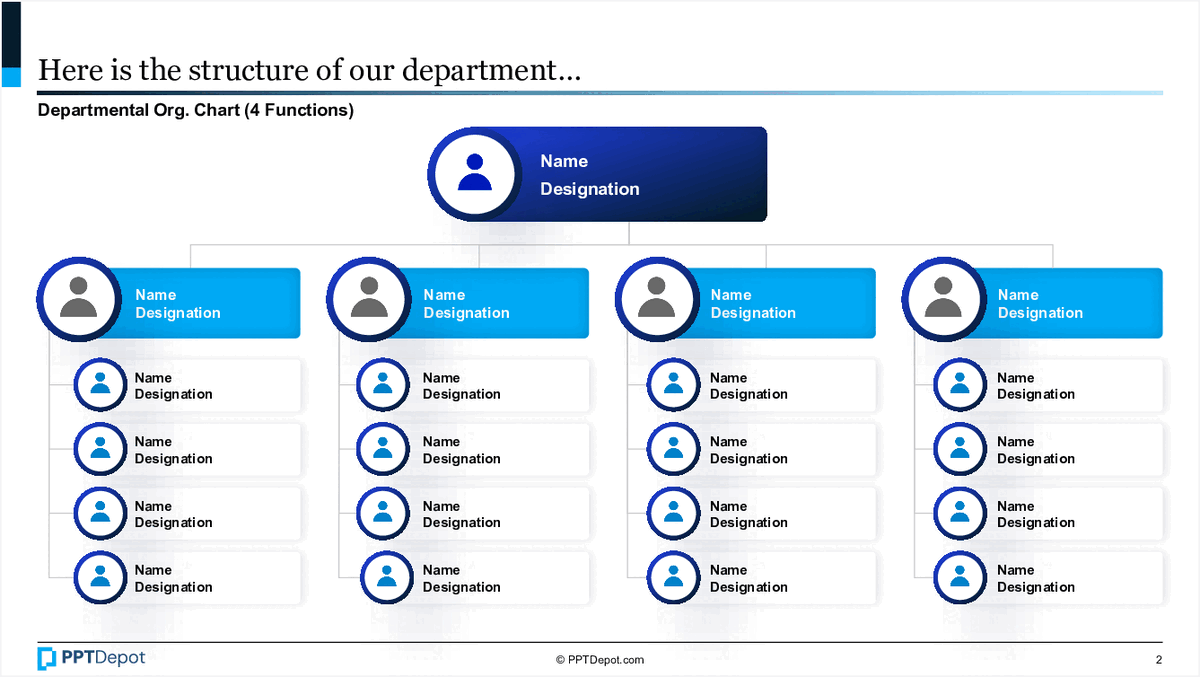
Departmental Organizational Structure

This slide illustrates the hierarchical layout of a department, highlighting 4 main functions and their respective team members. It provides a clear visual of reporting lines and team composition, designed for quick comprehension by senior management and strategic planners.


Departmental Organizational Chart

This slide illustrates the structure of a department through a visual hierarchy, displaying 3 main functions with their respective team members. It emphasizes clarity in reporting lines and role allocation, enabling quick understanding of departmental composition for strategic or operational planning.


Departmental Organizational Structure

This slide depicts a hierarchical chart illustrating the structure of a department with 5 key functions. It emphasizes individual roles, including names and designations, organized under a central leadership figure. The visual layout supports clarity in understanding reporting lines and team composition at a glance.


Departmental Organizational Chart

This slide displays a hierarchical structure of a department, illustrating the reporting relationships among ten functions. It uses icons and color coding to differentiate roles and positions, providing a clear visual of the department’s composition and reporting lines for strategic or operational review.


Departmental Organizational Chart

This slide illustrates a departmental structure with a focus on 3 primary functions. It displays a hierarchical layout, starting with a key leader and branching out to multiple team members, each with designated roles. The design emphasizes clarity in reporting lines and team composition for strategic or operational planning discussions.


Organizational Hierarchy Structure

This slide illustrates a hierarchical organizational structure with 5 sub-units branching from a central leadership role. It provides a clear visual of reporting lines and role designations, emphasizing the chain of command within a company or division. The layout is designed for quick comprehension by senior management and organizational design teams.


Explore Slides by Tags


This slide is part of the Company Profile PPT Templates collection.

View Full Company Profile PPT

Download 50+ FREE Templates Used by Consultants & Bankers

Download our FREE collection of over 50+ high-impact, fully editable PowerPoint templates. These professional templates cover a comprehensive range of strategic analysis frameworks—including Strategy Formulation, Innovation, Digital Transformation, Change Management, and many others—ideal for Management Consultants, Investment Bankers, Strategy Professionals, and Business Executives.

Download Now—Available for a Limited Time


Trusted by Leading Global Organizations


Our templates are trusted by thousands of organizations worldwide, including leading brands such as those listed below.

Abbott Accenture Airbus Allstate Amazon Barclays Bayer Blackrock Capgemini Chevron Cisco Coca-Cola Dell DHL EY Gartner GE Gilead Google Goldman Sachs LEK Mastercard McKesson Merck Nestle Nielsen Samsung Shell Siemens Unilever


Related Templates from PPT Depot


Leverage our domain and design expertise. Become a subscriber today:

100% Editable. Customize every PPTX presentation to fit your vision perfectly.
Domain Expertise. Built based on real-world consulting project deliverables.
High-Impact Design. Designed by McKinsey VGI presentation specialists.
Instant Access. Download and deploy templates on demand.
Always Fresh. Enjoy new templates added weekly.
Style Optionality. Choose from 3 unique design styles for every template.
Slide Production Services. Access a suite of slide production services.
Vote & Request Feature. Directly shape our PPT development pipeline.


Compare Our Plans


Each presentation is available in 3 color schemes. Download the version that most fits your firm's branding and customize it further once you download the PPTX file.


PPT Depot is your subscription to high-impact management consulting and investment banking templates—crafted from real-world deliverables by ex-MBB consultants and designed by former McKinsey Visual Graphics (VGI) presentation specialists. Compare plans here to determine what's the best fit for your firm.

With 15 years of experience, the team behind PPT Depot has empowered over 500+ clients across over 30+ countries. We currently produce 200,000 slides annually.

PPT Depot releases new templates each week. We have management topic-focused templates (e.g. market analysis, strategic planning, digital transformation, and more), alongside industry-specific collections. Peruse our full inventory here.

Save time and effort—elevate your presentations with proven domain and design expertise.

Got a question? Email us at [email protected].


Related Consulting Presentations


These presentations below are available for individual purchase from Flevy , the marketplace for business best practices.


Slide Customization & Production


We provide tailored slide customization and production services:

  • Conversion of scanned notes into PowerPoint slides
  • Development of PowerPoint master template
  • Creation of data-driven PowerPoint charts from hand-drawn graphs
  • Conversion of Excel charts to PowerPoint charts
  • Conversion of other file formats (e.g. PDF, TIF, Word Doc) to PowerPoint slides
  • Conversion of PowerPoint slides from one master template to another
  • Visual enhancement of existing PowerPoint presentations to increase the professional look of the presentation
Our presentation specialists are all ex-McKinsey Visual Graphics (VGI). Subscribers to the Executive Plan receive 2 hours of free slide slide production support each month. Learn more in the FAQs.


Accountability
Accountability Framework
ADKAR Model
AgriTech
Artificial Intelligence
Asset Management
Audit Trail
Automation
Automotive Industry
Autonomous Vehicles
Balanced Scorecard
Behavioral Change
Benchmarking
Biotech
Biotech Innovation
Blockchain
Blue Ocean Strategy
Business Analysis
Business Case
Business Continuity
Business Design
Business Development
Business Diagnostics
Business Growth
Business Model
Business Model Innovation
Business Performance
Business Planning
Business Portfolio
Business Scope
Business Strategy
Business Transformation
Capability Assessment
Capability Building
Capability Development
Capability Mapping
Capability Maturity
Capacity Planning
Change Management
Chemical Industry
Client Engagement
Client Journey
Client Solutions
Communication Planning
Communication Strategy
Company Profile
Competitive Analysis
Competitive Benchmarking
Competitive Differentiation
Competitive Dynamics
Competitive Forces
Competitive Intelligence
Competitive Landscape
Competitive Position
Competitive Positioning
Competitive Strategy
Compliance
Consumer Engagement
Content Strategy
Content Streaming
Contingency Planning
Continuous Improvement
Core Competencies
Core Values
Corporate Governance
Corporate Identity
Corporate Responsibility
Corporate Social Responsibility
Corporate Strategy
Cost Management
Cost Structure
Cost-Benefit Analysis
Creative Problem Solving
Crisis Management
Crisis Planning
Customer Engagement
Customer Experience
Customer Focus
Customer Insights
Customer Journey
Customer Lifecycle
Customer Perception
Customer Retention
Customer Satisfaction
Customer Segmentation
Customer Segments
Customer Service
Customer Value Proposition
Customer-Centric
Cybersecurity
Data Analysis
Data Visualization
Decision Framework
Decision Support
Decision-Making
Decision-Making Framework
Delivery Model
Departmental Design
Design Thinking
Differentiation

Digital Health
Digital Payments
Digital Transformation
Disaster Recovery
Disruption
Due Diligence
E-commerce
EdTech
Electric Vehicles
Emerging Markets
Emerging Technologies
Emissions Reduction
Energy Industry
Energy Transition
Engagement Strategy
Environmental Analysis
Environmental Factors
Environmental Impact
Environmental Scan
Environmental Scanning
Environmental, Social, Governance
ESG
Execution Framework
External Environment
External Factors
External Forces
External Influences
Financial Analysis
Financial Metrics
Financial Performance
Financial Technology
FinTech
Food Security
Forecasting
Future Scenarios
Gantt Chart
Gene Editing
Geopolitical Risk
Global Investment
Go-to-Market Strategy
Goal Setting
Governance
Governance Framework
Governance Model
Growth Drivers
Growth Opportunities
Growth Planning
Growth Potential
Growth Rate
Growth Strategy
Growth Trends
Healthcare Strategy
Hierarchy
Impact Assessment
Implementation Framework
Incident Management
Industry Analysis
Industry Assessment
Industry Benchmarking
Industry Competition
Industry Dynamics
Industry Forces
Industry Growth
Industry Landscape
Industry Lifecycle
Industry Mapping
Industry Risks
Industry Rivalry
Industry Roadmap
Industry Segmentation
Industry Segments
Industry Statistics
Industry Strategy
Industry Structure
Industry Timeline
Industry Trends
Industry Value Chain
Influence Mapping
Infrastructure Development
Infrastructure Investment
Initiative Sequencing
Innovation
Innovation Drivers
Innovation Framework
Innovation Management
Innovation Process
Innovation Strategy
Innovation Timeline
Internal-External Analysis
Investment Analysis
Investment Evaluation
Investment Opportunities
Investment Strategy
Investment Trends
Journey Mapping
Key Resources
KPI
KPI Dashboard
KPI Tracking
KPIs

Lead Conversion
Lead Qualification
Leadership
Leadership Alignment
Leadership Communication
Leadership Development
Leadership Framework
Lifecycle Management
Logistics
Logistics Strategy
Loyalty
Luxury Industry
Macro Environment
Management Dashboard
Management Framework
Manufacturing
Market Access
Market Adoption
Market Analysis
Market Assessment
Market Competition
Market Creation
Market Differentiation
Market Disruption
Market Drivers
Market Dynamics
Market Entry
Market Entry Barriers
Market Entry Strategy
Market Evolution
Market Expansion
Market Forces
Market Forecast
Market Growth
Market Maturity
Market Opportunities
Market Position
Market Positioning
Market Research
Market Segmentation
Market Share
Market Share Analysis
Market Size
Market Sizing
Market Statistics
Market Strategy
Market Structure
Market Timeline
Market Trends
Marketing Strategy
Maturity Model
Media Industry
Mergers and Acquisitions
Milestone Management
Milestone Tracking
Mining Industry
Mission and Vision
OKR
OKRs
Operational Alignment
Operational Benchmarking
Operational Dashboard
Operational Efficiency
Operational Excellence
Operational Framework
Operational Improvement
Operational Metrics
Operational Model
Operational Performance
Operational Planning
Operational Resilience
Operational Risk
Operational Risks
Operational Strategy
Opportunity Assessment
Opportunity Identification
Org Chart
Organizational Alignment
Organizational Change
Organizational Culture
Organizational Design
Organizational Development
Organizational Goals
Organizational Performance
Organizational Purpose
Organizational Resilience
Organizational Strategy
Organizational Structure
Organizational Transformation
Performance Comparison
Performance Dashboard
Performance Management
Performance Measurement
Performance Metrics
Performance Monitoring
Performance Tracking
PEST Analysis
PESTEL Analysis
PESTLE
PESTLE Analysis

Pipeline Management
Policy Impact
Porter's Five Forces
Portfolio Management
Pricing Strategy
Problem Solving
Process Framework
Process Improvement
Process Mapping
Process Optimization
Procurement Strategy
Product Development
Product Differentiation
Product Lifecycle
Product Management
Product Portfolio
Product Strategy
Progress Monitoring
Progress Tracking
Project Evaluation
Project Governance
Project Management
Project Planning
Project Prioritization
Project Timeline
Project Tracking
Regulatory Compliance
Regulatory Environment
Regulatory Trends
Renewable Energy
Reporting Lines
Resource Allocation
Resource Management
Resource Planning
Revenue Growth
Revenue Management
Risk Assessment
Risk Management
Risk Matrix
Risk Mitigation
Risk Prioritization
Roadmap
Robotics
Roles and Responsibilities
Sales Funnel
Sales Strategy
Scenario Planning
Service Portfolio
Stakeholder Alignment
Stakeholder Analysis
Stakeholder Communication
Stakeholder Engagement
Stakeholder Management
Stakeholder Mapping
Strategic Alignment
Strategic Analysis
Strategic Assessment
Strategic Communication
Strategic Differentiation
Strategic Evaluation
Strategic Execution
Strategic Framework
Strategic Gaps
Strategic Initiatives
Strategic Management
Strategic Planning
Strategic Positioning
Strategic Pricing
Strategic Prioritization
Strategic Risk
Strategic Roadmap
Strategic Sourcing
Strategy Development
Strategy Execution
Strategy Framework
Supplier Evaluation
Supply and Demand
Supply Chain
Supply Chain Management
Sustainability
Sustainability Metrics
Sustainability Strategy
SWOT Analysis
Team Composition
Team Structure
Technology Adoption
Technology Roadmap
Transformation
Transformation Framework
Transformation Planning
Transformation Roadmap
Triple Bottom Line
Value Chain
Value Creation
Value Innovation
Value Proposition
Vendor Evaluation
Vendor Management
Vision and Mission
Visual Management


Free PPT Maps Work illustrations by Storyset
© 2025 Copyright. PPT Depot LLC. All Rights Reserved