Why This Slide Is Useful
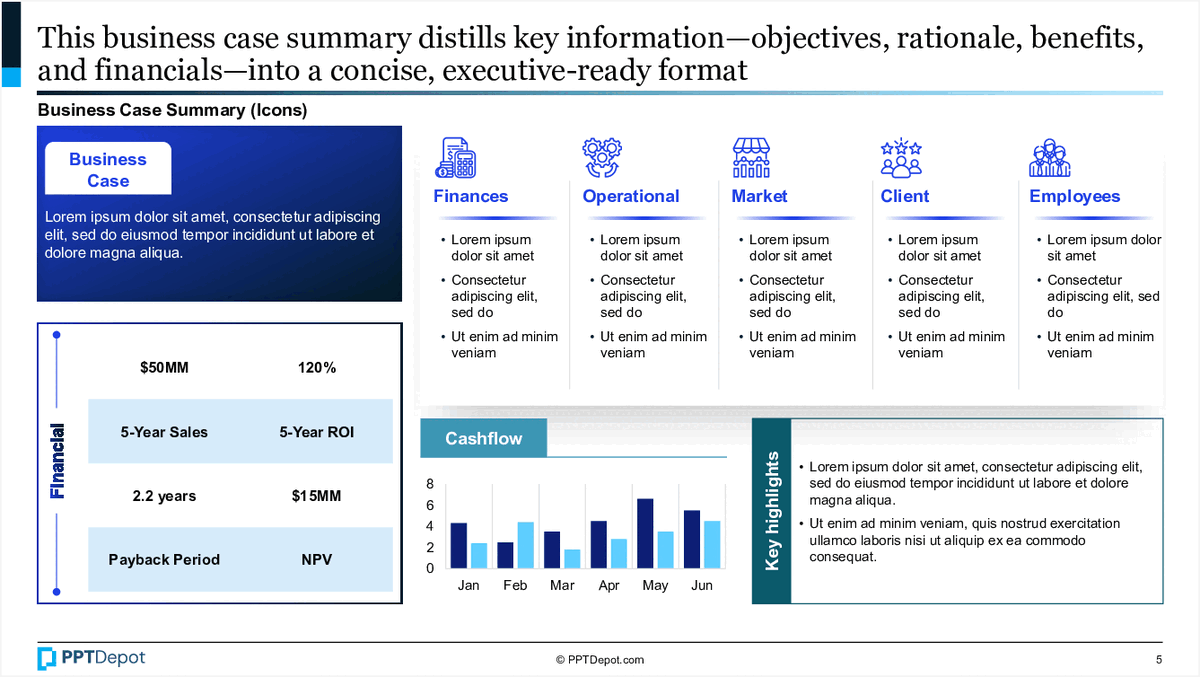
This slide is valuable for management consultants and senior executives because it distills complex business performance data into an accessible format. It enables rapid assessment of financial health and operational trends, supporting strategic discussions and investment decisions. The use of icons and visual cues helps to communicate key points efficiently, especially in high-level presentations or stakeholder updates.
For C-level leaders, this slide provides a snapshot of critical metrics that influence strategic priorities. It allows them to identify areas of strength or concern at a glance, guiding resource allocation and strategic focus. The structured layout supports alignment across departments by presenting data in a standardized, easy-to-interpret manner.
Management consultants can leverage this slide during client engagements to quickly frame the financial landscape. It serves as a baseline for deeper analysis or as a summary for executive buy-in. The visual emphasis on key figures ensures that strategic recommendations are grounded in clear, quantifiable insights.
In investor or board communications, this slide functions as a summary of business viability and growth potential. It offers a quick reference point for evaluating performance against targets, facilitating informed decision-making and strategic oversight.
How This Slide Is Used
This slide is typically used in strategic planning sessions, investment reviews, or performance reporting. It often appears in pitch decks or quarterly business reviews to provide a high-level overview of financial and operational status. Executives rely on it to communicate progress and justify strategic initiatives.
Consultants customize this slide to match client-specific metrics, often adding or removing data points based on relevance. For example, a client focusing on cash flow might emphasize the chart and key highlights, while another might highlight ROI and sales figures. The visual layout supports quick comprehension during fast-paced meetings.
In due diligence processes, this slide helps investors or acquirers understand the target company's financial fundamentals. It provides a snapshot that complements detailed financial models, enabling faster decision-making. The clarity of the data presentation reduces ambiguity and supports robust analysis.
During post-merger integration, this slide can be used to track early performance indicators. It helps leadership identify whether initial synergies are materializing and guides course corrections. The visual and structured format makes it easy to update and communicate progress regularly.
Related PPT Slides
Business Case Summary Structure
This slide illustrates the typical layout of a business case summary, emphasizing key components such as objectives, financial metrics, advantages, and supporting data visualizations. It demonstrates how to condense complex information into a clear, executive-ready format suitable for strategic decision-making and stakeholder presentations.
Quantitative Business Case Elements
This slide illustrates the 4 key components that underpin a robust business case: top-down business case, financial analysis, business modeling, and bottom-up benefits case. It emphasizes how these elements collectively support a data-driven justification for strategic initiatives, with visual cues distinguishing core deliverables from enabling factors.
Business Case Financial Model Overview
This slide compares financial and non-financial benefits within a business case framework, emphasizing quantifiable versus qualitative advantages. It categorizes benefits into revenue, cost, and capital-related metrics, alongside qualitative capture, providing a structured view for evaluating value creation opportunities.
This slide displays a 10-year financial analysis, highlighting projected benefits, investments, costs, and cash flows. It consolidates key financial metrics into a structured table, supporting strategic decision-making and investment evaluations for senior management and stakeholders.
Structured Business Case Development
This slide illustrates a five-phase process for developing a business case, from initial financial decomposition to finalization. It emphasizes a systematic approach to building a compelling business case, with each step supported by detailed bullet points that highlight key activities and considerations for execution. The visual flow underscores the importance of sequential progression for effective case development.
This slide illustrates the concept of price breakeven analysis, highlighting the point where total sales cover both variable and fixed costs, resulting in neither profit nor loss. It visually demonstrates how sales volume impacts profitability, emphasizing the importance of understanding cost structures for strategic pricing decisions. The diagram and annotations are designed to clarify the relationship between price, volume, and profitability for executive audiences.
Explore Slides by Tags
Download our FREE collection of over 50+ high-impact, fully editable PowerPoint templates. These professional templates cover a comprehensive range of strategic analysis frameworks—including Strategy Formulation, Innovation, Digital Transformation, Change Management, and many others—ideal for Management Consultants, Investment Bankers, Strategy Professionals, and Business Executives.
Trusted by Leading Global Organizations
Our templates are trusted by thousands of organizations worldwide, including leading brands such as those listed below.
Related Templates from PPT Depot

Leverage our domain and design expertise. Become a subscriber today:
Each presentation is available in 3 color schemes. Download the version that most fits your firm's branding and customize it further once you download the PPTX file.


PPT Depot is your subscription to high-impact management consulting and investment banking templates—crafted from real-world deliverables by ex-MBB consultants and designed by former McKinsey Visual Graphics (VGI) presentation specialists. Compare plans here to determine what's the best fit for your firm.
With 15 years of experience, the team behind PPT Depot has empowered over 500+ clients across over 30+ countries. We currently produce 200,000 slides annually.
PPT Depot releases new templates each week. We have management topic-focused templates (e.g. market analysis, strategic planning, digital transformation, and more), alongside industry-specific collections. Peruse our full inventory here.
Save time and effort—elevate your presentations with proven domain and design expertise.
Got a question? Email us at [email protected].
Related Consulting Presentations
These presentations below are available for individual purchase from Flevy , the marketplace for business best practices.

Slide Customization & Production
We provide tailored slide customization and production services:
- Conversion of scanned notes into PowerPoint slides
- Development of PowerPoint master template
- Creation of data-driven PowerPoint charts from hand-drawn graphs
- Conversion of Excel charts to PowerPoint charts
- Conversion of other file formats (e.g. PDF, TIF, Word Doc) to PowerPoint slides
- Conversion of PowerPoint slides from one master template to another
- Visual enhancement of existing PowerPoint presentations to increase the professional look of the presentation


